Question:
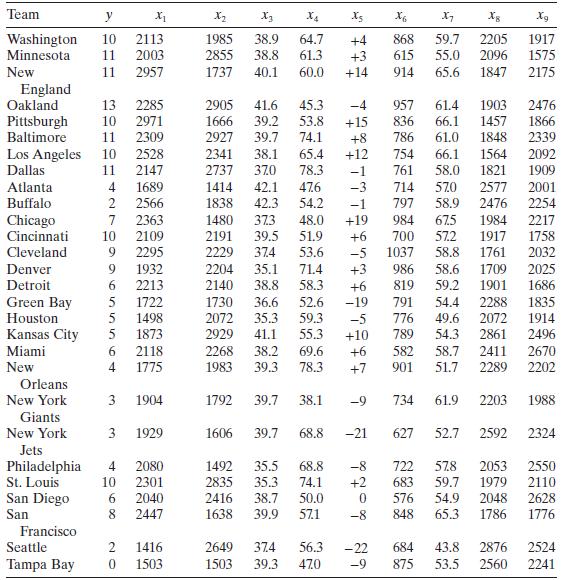
Consider the all-possible-regressions analysis of the National Football League data in Problem 10.2. Identify the subset regression models that are \(R^{2}\) adequate (0.05).
Data From Problem 10.2
Consider the National Football League data in Table B.1. Restricting your attention to regressors \(x_{1}\) (rushing yards), \(x_{2}\) (passing yards), \(x_{4}\) (field goal percentage), \(x_{7}\) (percent rushing), \(x_{8}\) (opponents' rushing yards), and \(x_{9}\) (opponents' passing yards), apply the all-possible-regressions procedure. Evaluate \(R_{p}^{2}, C_{p}\), and \(M S_{\text {Res }}\) for each model. Which subset of regressors do you recommend?
Transcribed Image Text:
Team X[ X2 X3 X4 Xs X6 1 Xg Washington 10 2113 1985 38.9 64.7 +4 868 59.7 2205 1917 Minnesota 11 2003 2855 38.8 61.3 +3 615 55.0 2096 1575 New 11 2957 1737 40.1 60.0 +14 914 65.6 1847 2175 England Oakland 13 2285 2905 41.6 45.3 -4 957 61.4 1903 2476 Pittsburgh 10 2971 1666 39.2 53.8 +15 836 66.1 1457 1866 Baltimore 11 2309 2927 39.7 74.1 +8 786 61.0 1848 2339 Los Angeles 10 2528 2341 38.1 65.4 +12 754 66.1 1564 2092 Dallas 11 2147 2737 370 78.3 -1 761 58.0 1821 1909 Atlanta 4 1689 1414 42.1 47.6 -3 714 57.0 2577 2001 Buffalo 2 2566 1838 42.3 54.2 -1 797 58.9 2476 2254 Chicago 7 2363 1480 373 48.0 +19 984 67.5 1984 2217 Cincinnati 10 2109 2191 39.5 51.9 +6 700 57.2 1917 1758 Cleveland 9 2295 2229 374 53.6 -5 1037 58.8 1761 2032 Denver Detroit Green Bay Houston Kansas City 45556 9 1932 2204 35.1 71.4 +3 986 58.6 1709 2025 6 2213 2140 38.8 58.3 +6 819 59.2 1901 1686 5 1722 1730 36.6 52.6 -19 791 54.4 2288 1835 5 1498 2072 35.3 59.3 -5 776 49.6 2072 1914 5 1873 2929 41.1 55.3 +10 789 54.3 2861 2496 Miami New 64 6 2118 2268 38.2 69.6 +6 582 58.7 2411 2670 4 1775 1983 39.3 78.3 +7 901 51.7 2289 2202 Orleans New York 3 1904 1792 39.7 38.1 -9 734 61.9 2203 1988 Giants New York 3 1929 1606 39.7 68.8 Jets Philadelphia 4 2080 1492 35.5 68.8 St. Louis 10 2301 2835 35.3 74.1 San Diego 6 2040 2416 38.7 50.0 San 8 2447 1638 39.9 57.1 Francisco Seattle Tampa Bay 20 1416 2649 374 56.3 0 1503 1503 39.3 47.0 -21 627 52.7 2592 2324 722 57.8 2053 2550 +2 683 59.7 1979 2110 576 54.9 2048 2628 848 65.3 1786 1776 -22 684 43.8 2876 2524 875 53.5 2560 2241