

Redo question 28, this time using only data from 1978 to 1987. Does your answer to part
Question:
Redo question 28, this time using only data from 1978 to 1987. Does your answer to part
(c) change? If so, account for this result.
Question 28
Use MINITAB and the data given in question 27 and the equations given in question 26.
(a) Draw a graph showing the actual amount of sales and the estimate of sales based on equation A.
(b) Draw a graph showing the actual amount of sales and the estimate of sales based on equation B.
(c) Referring to the graphs you drew in parts
(a) and (b), compare the two models used for forecasting. Which model does a better job?
Question 27
Suppose you are given the following data for Abbott Laboratories sales.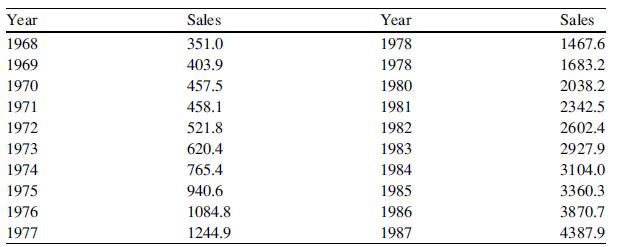
Use MINITAB to do the following:
(a) Use model A from question 26 to estimate the relationship between sales and time (t).
(b) Use model B from question 26 to estimate the relationship among sales, time (t), and the square of time (t2).
Question 26
In order to forecast the value of a variable, we sometimes use a nonlinear trend regression such as![]()
where t = time. Briefly explain why this model may be better than a model such as![]()
Step by Step Answer:

This question has not been answered yet.
You can Ask your question!


Statistics For Business And Financial Economics
ISBN: 9781461458975
3rd Edition
Authors: Cheng Few Lee , John C Lee , Alice C Lee
