

Refer to Exercise 2.18 and calculate the number of the 600 items falling into each of the
Question:
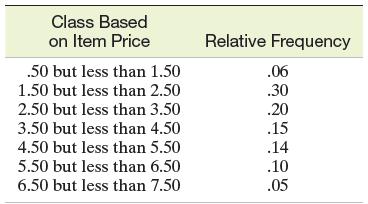
Refer to Exercise 2.18 and calculate the number of the 600 items falling into each of the classes. Then graph a frequency histogram for these data.
Data from Exercise 2.18
A company is analyzing the prices at which its items are sold. Graph the relative frequency histogram for the 600 items summarized in the accompanying relative frequency table.
Step by Step Answer:

This question has not been answered yet.
You can Ask your question!
Related Book For 

Statistics For Business And Economics
ISBN: 9781292227085
13th Global Edition
Authors: Terry Sincich James Mcclave, P. George Benson
Question Posted:
