

The following table shows the sales figures for 4 salespeople on 3 randomly selected days. Use analysis
Question:
The following table shows the sales figures for 4 salespeople on 3 randomly selected days. Use analysis of variance to test the hypothesis that the mean daily sales figures (in thousands of dollars) are the same for all 4 salespeople.
That is, test H0: μ1 = μ2 = μ3 = μ4. Use α = .05.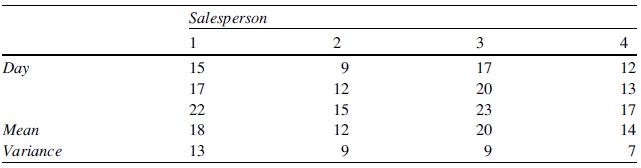
Fantastic news! We've Found the answer you've been seeking!
Step by Step Answer:

Answered By
Wahome Michael
I am a CPA finalist and a graduate in Bachelor of commerce. I am a full time writer with 4 years experience in academic writing (essays, Thesis, dissertation and research). I am also a full time writer which assures you of my quality, deep knowledge of your task requirement and timeliness. Assign me your task and you shall have the best.
Thanks in advance
63+ Reviews
132+ Question Solved
Related Book For 

Statistics For Business And Financial Economics
ISBN: 9781461458975
3rd Edition
Authors: Cheng Few Lee , John C Lee , Alice C Lee
Question Posted:
