

Use a bar graph to plot the cumulative relative frequency. Use the goaltenders salaries for the 1991
Question:
Use a bar graph to plot the cumulative relative frequency.
Use the goaltenders’ salaries for the 1991 NHL season given in the following table to answer question.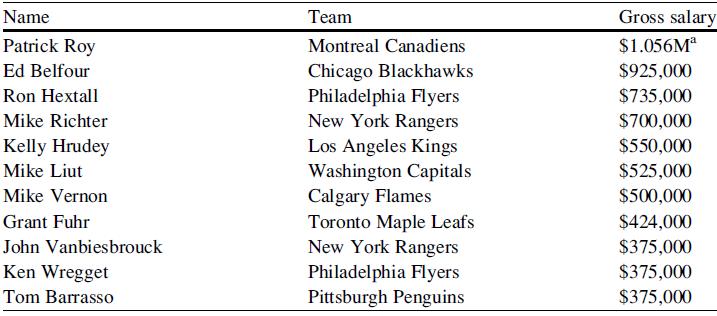
Fantastic news! We've Found the answer you've been seeking!
Step by Step Answer:
SOLUTION Here is a bar graph plotting the cumulative relative frequency of goalte...View the full answer

Answered By
Pallavi Masotiya
I have been tutoring for over two years. I have experience in tutoring at all levels, from elementary to high school. I specialize in Computer Science, Programming languages, and DBMS.. I have worked with a variety of students from different backgrounds and learning styles. I am patient and understanding, and I strive to make learning fun and engaging. I believe that every student can be successful with the right guidance and resources.
Thankyou thats All
0 Reviews
10+ Question Solved
Related Book For 

Statistics For Business And Financial Economics
ISBN: 9781461458975
3rd Edition
Authors: Cheng Few Lee , John C Lee , Alice C Lee
Question Posted:
