

Use a bar graph to show the distribution of votes. To answer question, use the following results
Question:
Use a bar graph to show the distribution of votes.
To answer question, use the following results of the election to the General Assembly from one New Jersey district in 1991.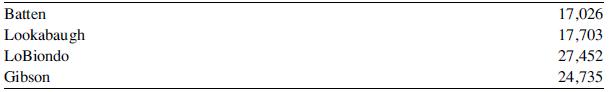
Fantastic news! We've Found the answer you've been seeking!
Step by Step Answer:
Here is the bar graph sho...View the full answer

Answered By
Morgan Njeri
Very Versatile especially in expressing Ideas in writings.
Passionate on my technical knowledge delivery.
Able to multitask and able to perform under pressure by handling multiple challenges that require time sensitive solution.
Writting articles and video editing.
Revise written materials to meet personal standards and satisfy clients demand.
Help Online Students with their course work.
12+ Reviews
38+ Question Solved
Related Book For 

Statistics For Business And Financial Economics
ISBN: 9781461458975
3rd Edition
Authors: Cheng Few Lee , John C Lee , Alice C Lee
Question Posted:
