

Use a pie chart to show how San Franciscos total team offense is divided between rush and
Question:
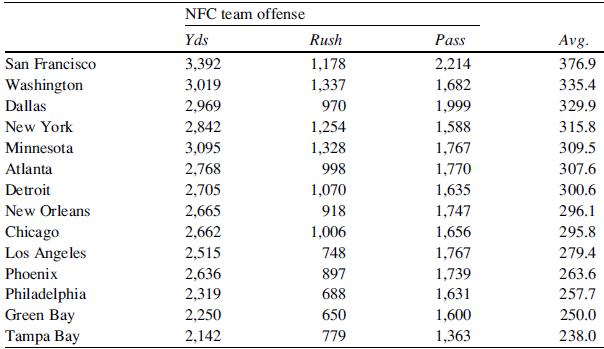
Use a pie chart to show how San Francisco’s total team offense is divided between rush and pass.
To answer question, refer to the table, which gives the rankings for team defense and offense for NFC teams for the first 9 weeks of the 1991 season.
Rankings of team defense and offense for NFC teams in the 1991 season.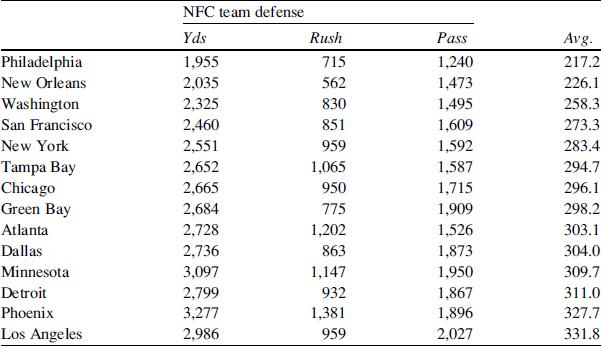
Fantastic news! We've Found the answer you've been seeking!
Step by Step Answer:
To create a pie chart representing San Franciscos total team offense divided between rush and pass y...View the full answer

Answered By
Shubhradeep Maity
I am an experienced and talented freelance writer passionate about creating high-quality content. I have over five years of experience working in the field and have collaborated with several renowned companies and clients in the SaaS industry.
At Herman LLC, an online collective of writers, I generated 1,000+ views on my content and created journal content for 100+ clients on finance topics. My efforts led to a 60% increase in customer engagement for finance clients through revamping website pages and email interaction.
Previously, at Gerhold, a data management platform using blockchain, I wrote and published over 50 articles on topics such as Business Finance, Scalability, and Financial Security. I managed four writing projects concurrently and increased the average salary per page from $4 to $7 in three months.
In my previous role at Bernier, I created content for 40+ clients within the finance industry, increasing sales by up to 40%.
I am an accomplished writer with a track record of delivering high-quality content on time and within budget. I am dedicated to helping my clients achieve their goals and providing exceptional results.
1+ Reviews
10+ Question Solved
Related Book For 

Statistics For Business And Financial Economics
ISBN: 9781461458975
3rd Edition
Authors: Cheng Few Lee , John C Lee , Alice C Lee
Question Posted:
