

Use the results you got in question 85 to plot sample means against sample standard deviation. What
Question:
Use the results you got in question 85 to plot sample means against sample standard deviation. What is the probability of the range, the sample means between .45 and .55, and the sample standard deviation between .2 and .35?
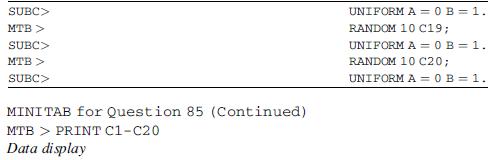
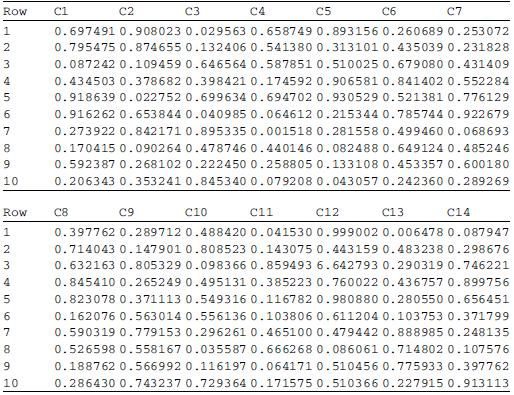
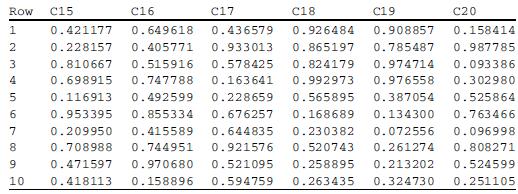
Question 85
The MINITAB output in the figure (see pages 371–372) is 20 random samples drawn from a uniform distribution between 0 and 1. Calculate the sample means and sample standard deviations by using the MINITAB program.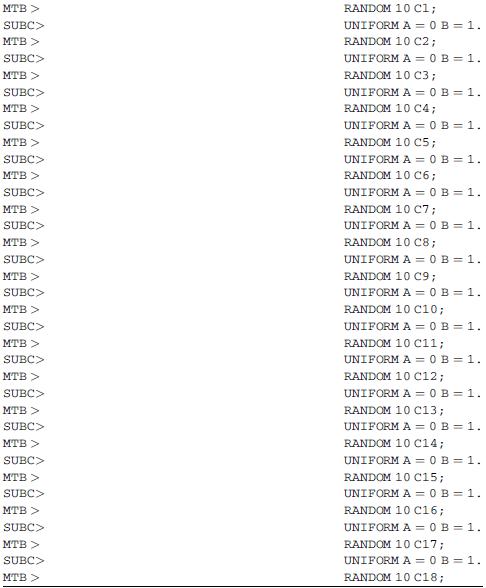
Step by Step Answer:

This question has not been answered yet.
You can Ask your question!
Related Book For 

Statistics For Business And Financial Economics
ISBN: 9781461458975
3rd Edition
Authors: Cheng Few Lee , John C Lee , Alice C Lee
Question Posted:
