

Aroni and Fletcher (1979) presented data on the compressive and tensile strength of mortar used to line
Question:
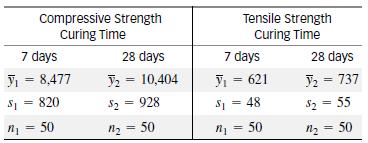
Aroni and Fletcher (1979) presented data on the compressive and tensile strength of mortar used to line steel water pipelines. They noted that mortar strength is expected to increase as the curing time of the mortar increases from 7 to 28 days. The compressive and tensile strength means and standard deviations, each based on the testing of samples of n = 50 specimens, are shown in the accompanying table.
a. Refer to the compressive strength data and regard the two curing times as treatments. Find the total for all n = 100 observations. Then find CM and calculate SST.
b. Find SSE.
c. Find SS (Total).
d. Construct an analysis of variance table for the results of parts a–c.
e. Suppose the researchers want to estimate the mean compressive strength of the mortar mix using a simple linear regression model to relate mean compressive strength E( y) to curing time x over the time interval from 7 to 28 days. Explain why the least-squares line will pass through the points (7, y̅1) and (28, y̅2).
f. Find the least-squares line.
g. Use the prediction equation and the value of SSE found in part b to find a 95% confidence interval for the mean compressive strength at x = 20 days.
h. Find r2 and interpret its value.
Step by Step Answer:


Statistics For Engineering And The Sciences
ISBN: 9781498728850
6th Edition
Authors: William M. Mendenhall, Terry L. Sincich
