

B. Render (Rollins College) and R. M. Stair (Florida State University) presented the case of the Bayfield
Question:
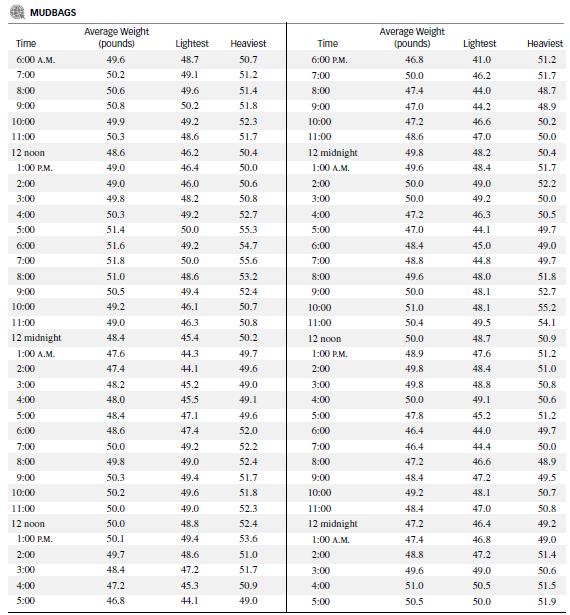
B. Render (Rollins College) and R. M. Stair (Florida State University) presented the case of the Bayfield Mud Company (Quantitative Analysis of Management, 1997). Bayfield supplies boxcars of 50-pound bags of mud-treating agents to the Wet-Land Drilling Company. Mud-treating agents are used to control the pH and other chemical properties of the cone during oil drilling operations. Wet-Land has complained to Bayfield that its most recent shipment of bags were underweight by about 5%. (The use of underweight bags may result in poor chemical control during drilling, which may hurt drilling efficiency, resulting in serious economic consequences.) Afraid of losing a long-time customer, Bayfield immediately began investigating their production process. Management suspected that the causes of the problem were the recently added third shift and the fact that all three shifts were under pressure to increase output to meet increasing demand for the product. Their quality control staff began randomly sampling and weighing six bags of output each hour. The average weight of each sample over the last three days is recorded in the table along with the weight of the heaviest and lightest bag in each sample.
a. Construct both an R-chart and x̅-chart for these data.
b. Is the process under statistical control?
c. Does it appear that management’s suspicion about the third shift is correct? Explain?
Step by Step Answer:


Statistics For Engineering And The Sciences
ISBN: 9781498728850
6th Edition
Authors: William M. Mendenhall, Terry L. Sincich
