

Construct an R-chart for the data of Exercise 16.12 to monitor the variation in the diameters of
Question:
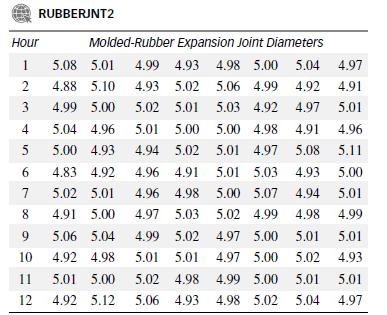
Construct an R-chart for the data of Exercise 16.12 to monitor the variation in the diameters of the molded-rubber expansion joints produced by the manufacturing process. Does the process appear to be in control?
Data from Exercise 16.12
Refer to the production of molded-rubber expansion joints used in heating and air conditioning systems, Exercise 16.6. To monitor the mean of the manufacturing process, eight joints (rather than one joint) were randomly selected from the production line and their diameters (in inches) measured each hour, for a period of 12 hours, as shown in the table. The data for the 12 samples will be used to construct an x̅-chart.
Data from Exercise 16.6
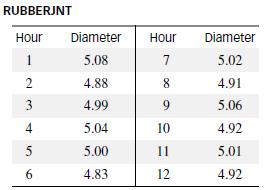
Molded-rubber expansion joints, used in heating and air-conditioning systems, are designed to have internal diameters of 5 inches. To monitor the manufacturing process, one joint was randomly selected each hour from the production line and its diameter (in inches) measured, for a period of 12 hours, as shown in the table. The data will be used to construct a variable control chart.
Step by Step Answer:


Statistics For Engineering And The Sciences
ISBN: 9781498728850
6th Edition
Authors: William M. Mendenhall, Terry L. Sincich
