

Duke Universitys Pratt School of Engineering commissioned a survey on Americans attitudes toward engineering. A telephone survey
Question:
Duke University’s Pratt School of Engineering commissioned a survey on Americans’ attitudes toward engineering. A telephone survey was conducted among a representative national sample of 808 American adults in January, 2009. One of the survey questions asked, “Do you believe the field of engineering is winning or losing young people?” The results are summarized in the pie chart.
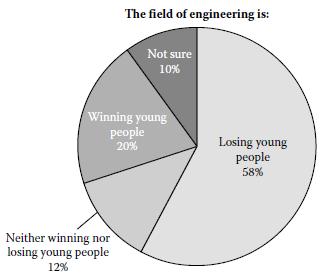 a. What variable is described in the pie chart? What are the categories (classes)?
b. Explain what the “20%” represents in the chart.
c. Convert the pie chart into a Pareto diagram.
d. Based on the graphs, what is the majority opinion of American adults responding to the survey question?
Step by Step Answer:
a The variable described in the pie chart is the op...View the full answer


Statistics For Engineering And The Sciences
ISBN: 9781498728850
6th Edition
Authors: William M. Mendenhall, Terry L. Sincich
