

Refer to the simple linear regression of sweetness index y and amount of pectin x for n
Question:
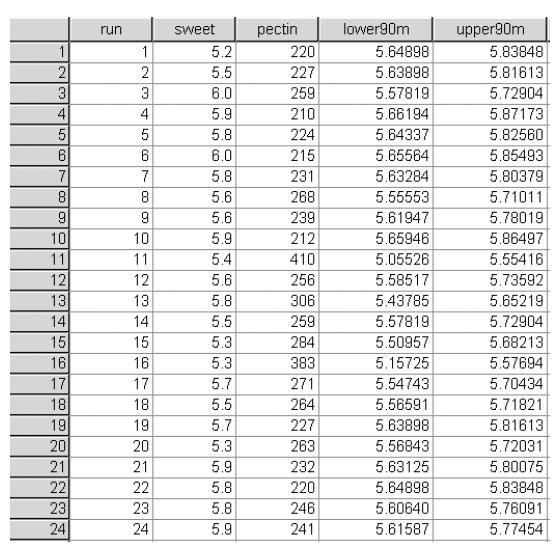
Refer to the simple linear regression of sweetness index y and amount of pectin x for n = 24 orange juice samples, Exercise 10.12. The SPSS printout of the analysis is shown below. A 90% confidence interval for the mean sweetness index, E(y), for each value of x is shown below on the SPSS spreadsheet. Select an observation and interpret this interval.
Data from Exercise 10.12
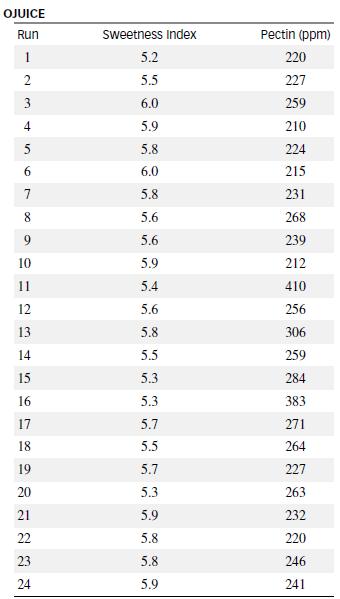
The quality of the orange juice produced by a manufacturer (e.g., Minute Maid, Tropicana) is constantly monitored. There are numerous sensory and chemical components that combine to make the best tasting orange juice. For example, one manufacturer has developed a quantitative index of the “sweetness” of orange juice (the higher the index, the sweeter the juice). Is there a relationship between the sweetness index and a chemical measure such as the amount of water-soluble pectin (parts per million) in the orange juice? Data collected on these two variables for 24 production runs at a juice manufacturing plant are shown in the next table. Suppose a manufacturer wants to use simple linear regression to predict the sweetness (y) from the amount of pectin (x).
Step by Step Answer:


Statistics For Engineering And The Sciences
ISBN: 9781498728850
6th Edition
Authors: William M. Mendenhall, Terry L. Sincich
