

Refer to the x- and R-charts, Exercises 16.8 and 16.17. Conduct a runs analysis to detect any
Question:
Refer to the x̅- and R-charts, Exercises 16.8 and 16.17. Conduct a runs analysis to detect any trend in the process.
Data from Exercise 16.8
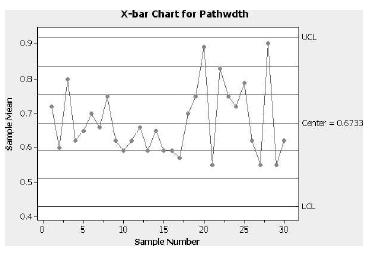
The central processing unit (CPU) of a microcomputer is a computer chip containing millions of transistors. Connecting the transistors are slender circuit paths only .5 to .85 micron wide. A manufacturer of CPU chips knows that if the circuit paths are not .5–.85 micron wide, a variety of problems will arise in the chips’ performance. The manufacturer sampled four CPU chips six times a day (every 90 minutes from 8:00 A.M. until 4:30 P.M.) for five consecutive days and measured the circuit path widths. These data and MINITAB were used to construct the -chart shown below.
Data from Exercise 16.17:
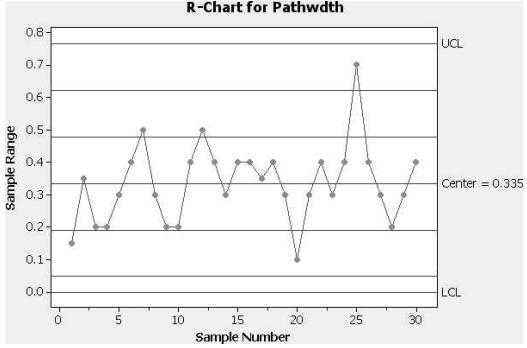
The desired circuit path widths were .5 to .85 micron. The manufacturer sampled four CPU chips six times a day (every 90 minutes from 8:00 A.M. until 4:30 P.M.) for five consecutive days. The path widths were measured and used to construct the MINITAB R-chart shown below.
Step by Step Answer:
A runs analysis is a valuable tool in statistical process control that helps us identify patterns or trends in data It involves counting consecutive d...View the full answer


Statistics For Engineering And The Sciences
ISBN: 9781498728850
6th Edition
Authors: William M. Mendenhall, Terry L. Sincich
