

The data in the table below are sales, y, in thousands of dollars per week, for home
Question:
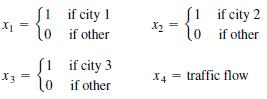
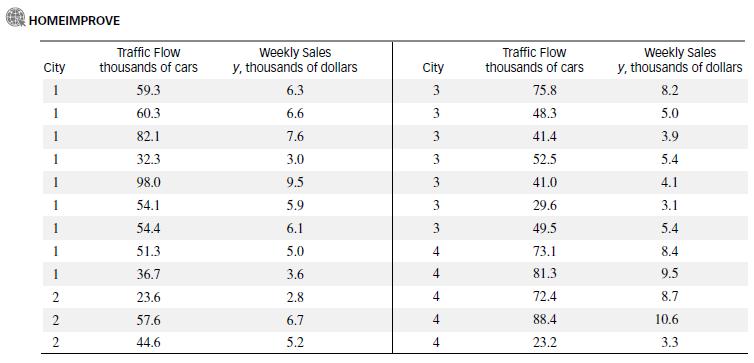
The data in the table below are sales, y, in thousands of dollars per week, for home improvement outlets in each of four cities. The objective is to model sales, y, as a function of traffic flow, adjusting for city-to-city variations that might be due to size or other market conditions. The model is
E(y) = βo + β1x1 + β2x2 + β3x3 + β4x4
where
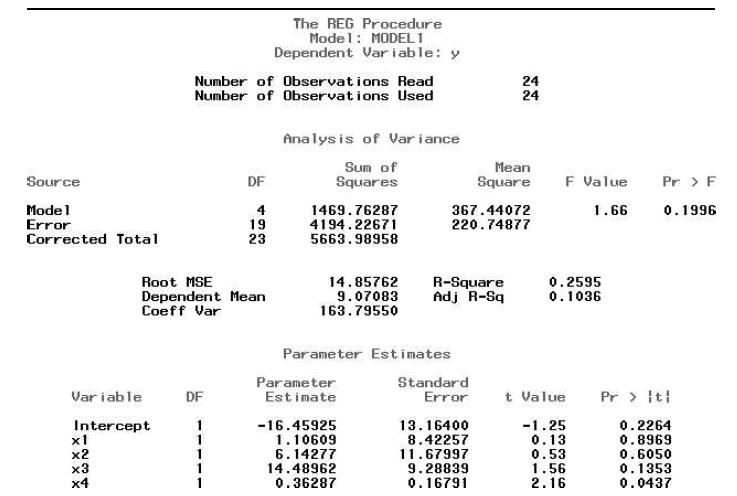
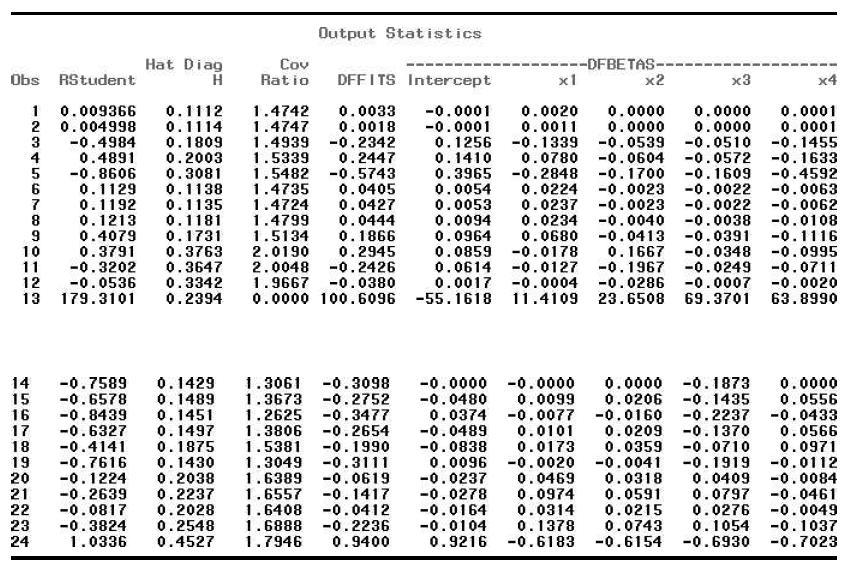
A SAS printout for the regression analysis is provided below.
a. Is the model statistically useful for predicting y? Explain.
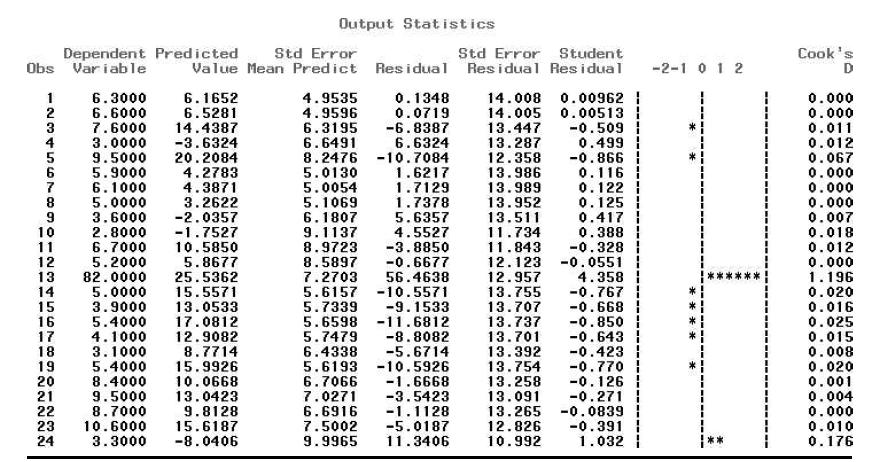
b. Do you detect any outliers?
c. Refer to part b. Are the outliers detected in the residual plot influential?
d. Note that the value of sales (y) for the 13th observation was incorrectly entered into the computer as 82.0; the correct value is 8.2. Make the correction and rerun the regression analysis. Interpret the results.
Step by Step Answer:

This question has not been answered yet.
You can Ask your question!


Statistics For Engineering And The Sciences
ISBN: 9781498728850
6th Edition
Authors: William M. Mendenhall, Terry L. Sincich
