

For Exercise 20.13, compute the five-day moving averages, and superimpose these on the same graph. Does this
Question:
In exercise 20.13
The following daily sales figures have been recorded in a medium-size merchandising firm.
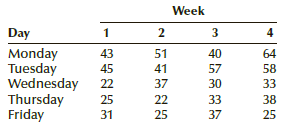
a. Compute the three-day moving averages.
b. Plot the time series and the moving averages on a graph.
c. Does there appear to be a seasonal (weekly) pattern?
Fantastic news! We've Found the answer you've been seeking!
Step by Step Answer:
a Sales 3Day moving average 5Day moving average 43 45 4345223 3667 22 4522253 3067 43452225315 ...View the full answer

Answered By
Sagar Kumar
I am Mechanical Engineer with CGPA of 3.98 out of 4.00 from Pakistan. I went to Government Boys Degree College, Sehwan for high school studies.
I appeared in NUST Entrance Exam for admission in university and ranked #516. My mathematics are excellent and I have participated in many math competitions and also won many of them. Recently, I participated in International Youth Math Challenge and was awarded with Gold Honor. Now, I am also an ambassador at International Youth Math Challenge,
I have been teaching when I was in 9th class class year 2012. I have taught students from 6th class to university level.
1+ Reviews
10+ Question Solved
Related Book For 
Question Posted:
