

Question: A time-series plot often helps you determine the appropriate model to use. For this problem, use each of the time series presented in the following
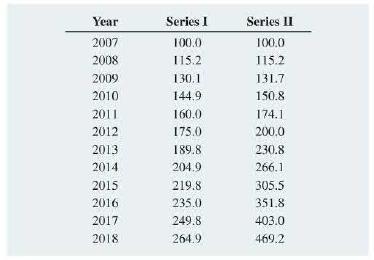
A time-series plot often helps you determine the appropriate model to use. For this problem, use each of the time series presented in the following table and stored in Time Series B.
a. Plot the observed data Y over time X and plot the logarithm of the observed data (log Y) over time X to determine whether a linear trend model or an exponential trend model is more appropriate.
b. Compute the appropriate forecasting equation.
c. Forecast the value for 2019.
Year Series I Series II 2007 100.0 100.0 2008 115.2 115.2 2009 130.1 131.7 2010 144.9 150.8 2011 160.0 174.1 2012 175.0 200,0 2013 189.8 230.8 2014 204.9 266,1 2015 219.8 305.5 2016 235.0 351.8 2017 249.8 403.0 2018 264.9 469.2
Step by Step Solution
3.59 Rating (149 Votes )
There are 3 Steps involved in it
a b c For Time Series I the graph of Y versus X appears t... View full answer

Get step-by-step solutions from verified subject matter experts