

Question: Although you should not expect a perfectly fitting model for any time-series data, you can consider the first differences, second differences, and percentage differences for
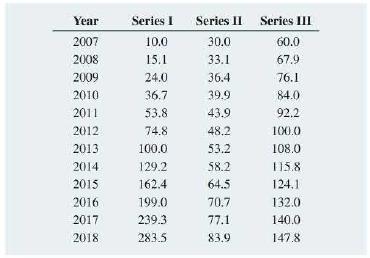
Although you should not expect a perfectly fitting model for any time-series data, you can consider the first differences, second differences, and percentage differences for a given series as guides in choosing an appropriate model. For this problem, use each of the time series presented in the following table and stored in Time Series A.
a. Determine the most appropriate model.
b. Compute the forecasting equation.
c. Forecast the value for 2019.
Series I Series II Year Series III 2007 10.0 30.0 60.0 2008 15.1 33.1 67.9 2009 24.0 36.4 76.1 2010 36.7 39.9 84.0 2011 53.8 43.9 92.2 2012 74.8 48.2 100.0 2013 100.0 53.2 108.0 2014 129.2 58.2 115.8 2015 162.4 64.5 124.1 2016 199.0 70,7 132.0 2017 239.3 77.1 140.0 2018 283.5 83.9 147.8
Step by Step Solution
3.56 Rating (167 Votes )
There are 3 Steps involved in it
ANSWER To determine the most appropriate model for each of the time series we need to look at t... View full answer

Get step-by-step solutions from verified subject matter experts