

Question: How have stocks performed in the past? The following table presents the data stored in Stock Performance, which show the performance of a broad measure
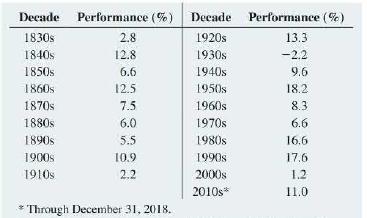
How have stocks performed in the past? The following table presents the data stored in Stock Performance, which show the performance of a broad measure of stock performance (by percentage) for each decade from the 1830s through the 2010s:
a. Plot the time series.
b. Fit a three-period moving average to the data and plot the results.
c. Using a smoothing coefficient of W = 0.50, exponentially smooth the series and plot the results.
d. What is your exponentially smoothed forecast for the 2020s?
e. Repeat (c) and (d), using W = 0.25.
f. Compare the results of (d) and (e).
g. What conclusions can you reach concerning how stocks have performed in the past?
Decade Performance (%) Decade Performance (%) 1830s 2.8 1920s 13.3 1840s 12.8 1930s -2.2 1850s 6.6 1940s 9.6 1860s 12.5 1950s 18.2 1870s 7.5 1960s 8.3 1880s 6.0 1970s 6.6 1890s 5.5 1980s 16.6 1900s 10.9 1990s 17.6 1910s 2.2 2000s 1.2 2010s* 11.0 * Through December 31, 2018.
Step by Step Solution
3.38 Rating (151 Votes )
There are 3 Steps involved in it
a Performance 20 15 wwww M 1840s Stock Performance by Decade 1860... View full answer

Get step-by-step solutions from verified subject matter experts