

Question: The data below, stored in Computer Usage represent the hours per day spent by American desktop and laptop users from 2008 to 2017. a. Plot
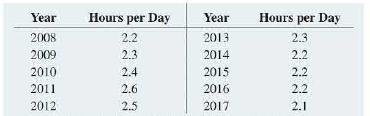
The data below, stored in Computer Usage represent the hours per day spent by American desktop and laptop users from 2008 to 2017.
a. Plot the time series.
b. Fit a three-year moving average to the data and plot the results.
c. Using a smoothing coefficient of W = 0.50, exponentially smooth the series and plot the results.
d. What is your exponentially smoothed forecast for 2018?
e. Repeat (c) and (d), using W = 0.25.
f. Compare the results of (d) and (e).
g. What conclusions can you reach about desktop/laptop use by American users?
Year Hours per Day Year Hours per Day 2008 2.2 2013 2.3 2009 2.3 2014 2.2 2010 2.4 2015 2.2 2011 2.6 2016 2.2 2012 2.5 2017 2.1
Step by Step Solution
3.27 Rating (159 Votes )
There are 3 Steps involved in it
A Hours 30 25 20 15 10 05 0... View full answer

Get step-by-step solutions from verified subject matter experts