

Question: The following data, stored in Core Appliances , list the number of shipments of core major household appliances in the United States from 2000 to
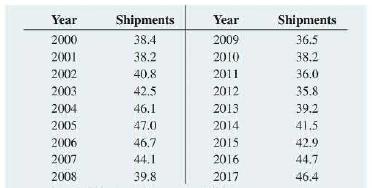
The following data, stored in Core Appliances , list the number of shipments of core major household appliances in the United States from 2000 to 2017 (in millions).
a. Plot the time series.
b. Fit a three-year moving average to the data and plot the results.
c. Using a smoothing coefficient of W = 0.50, exponentially smooth the series and plot the results.
d. What is your exponentially smoothed forecast for 2018?
e. Repeat (c) and (d), using W = 0.25.
f. Compare the results of (d) and (e).
g. What conclusions can you reach concerning the total number of shipments of core major household appliances in the United States from 2000 to 2017 (in millions)?
Year Shipments Year Shipments 2000 38.4 2009 36.5 2001 38.2 2010 38.2 2002 40.8 2011 36.0 2003 42.5 2012 35.8 2004 46.1 2013 39.2 2005 47.0 2014 41.5 2006 46.7 2015 42.9 2007 44.1 2016 44.7 2008 39.8 2017 46.4
Step by Step Solution
3.34 Rating (166 Votes )
There are 3 Steps involved in it
a US Shipment of Core Major Household Appliances by Year millions 50 Shipments millions 40 30 20 10 ... View full answer

Get step-by-step solutions from verified subject matter experts