

Question: The data analyst from Problem 16.7 also obtained information regarding whether the employee was on a standard 8-hour shift or on flextime. The cross-tabulation between
The data analyst from Problem 16.7 also obtained information regarding whether the employee was on a standard 8-hour shift or on flextime. The cross-tabulation between these two variables appears below. Percentage the table and calculate gamma. Is there a relationship between the employment status of employees (shift versus flextime) and job satisfaction?
Data in Problem 16.7
The director of the state department of motor vehicles is concerned about the high level of employee dissatisfaction in the department. To alleviate this problem, he hires a statistical analyst to investigate the attitudes of employees. The analyst believes that the primary source of dissatisfaction is the type of job held by the employee—hourly wage or salary. To test this hypothesis, she obtains data pertaining to whether the employee is paid hourly or is salaried and whether he or she is satisfied or dissatisfied with the job. These data are cross-tabulated in the accompanying table. Percentage the table and calculate gamma. Refer to the book’s Website for the calculation of gamma in larger tables. Is there a relationship between type of job and job satisfaction?
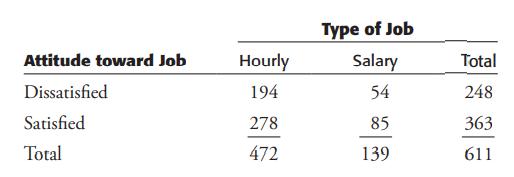
Attitude toward Job Dissatisfied Satisfied Total Hourly 194 278 472 Type of Job Salary 54 85 139 Total 248 363 611
Step by Step Solution
3.58 Rating (162 Votes )
There are 3 Steps involved in it

Get step-by-step solutions from verified subject matter experts