

Question: An engineer is comparing the time to failure (in flight hours) of two different air conditioners for airplanes and wants to determine if the median
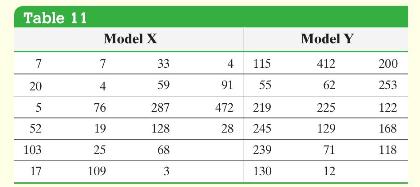
An engineer is comparing the time to failure (in flight hours) of two different air conditioners for airplanes and wants to determine if the median time to failure for model \(\mathrm{Y}\) is longer than the median time to failure for model \(\mathrm{X}\). She obtains a random sample of 22 failure times for model \(\mathrm{X}\) and an independent random sample of 17 failure times for model Y. Do the data in Table 11 suggest that the time to failure for model Y is longer? Use the 0.05 level of significance. Normal probability plots indicate that neither data set is normally distributed.
Approach Verify that the requirement of independent random samples is satisfied and then proceed to follow Steps 1 through 5. Continue to assume that the shapes of the distributions are the same. This can be roughly confirmed by considering the boxplots in Figure 11.
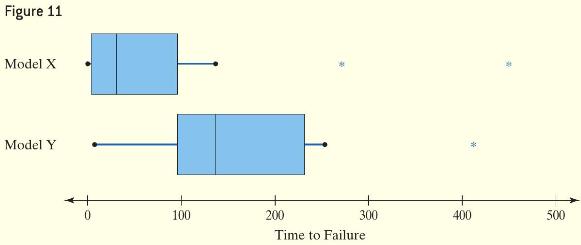
Table 11 Model X Model Y 7 7 33 4 115 412 200 20 20 4 59 91 55 62 253 5 76 287 472 219 225 122 52 19 128 28 245 129 168 103 25 68 239 71 118 17 109 3 130 12
Step by Step Solution
3.37 Rating (150 Votes )
There are 3 Steps involved in it
The samp... View full answer

Get step-by-step solutions from verified subject matter experts