

Question: 1. What is the problem about? 2. Which methods have been used? 3. What do you understand from figures? 4. What kind of solution have
1. What is the problem about? 2. Which methods have been used? 3. What do you understand from figures? 4. What kind of solution have been found? 5. What is the result of this project/case study?
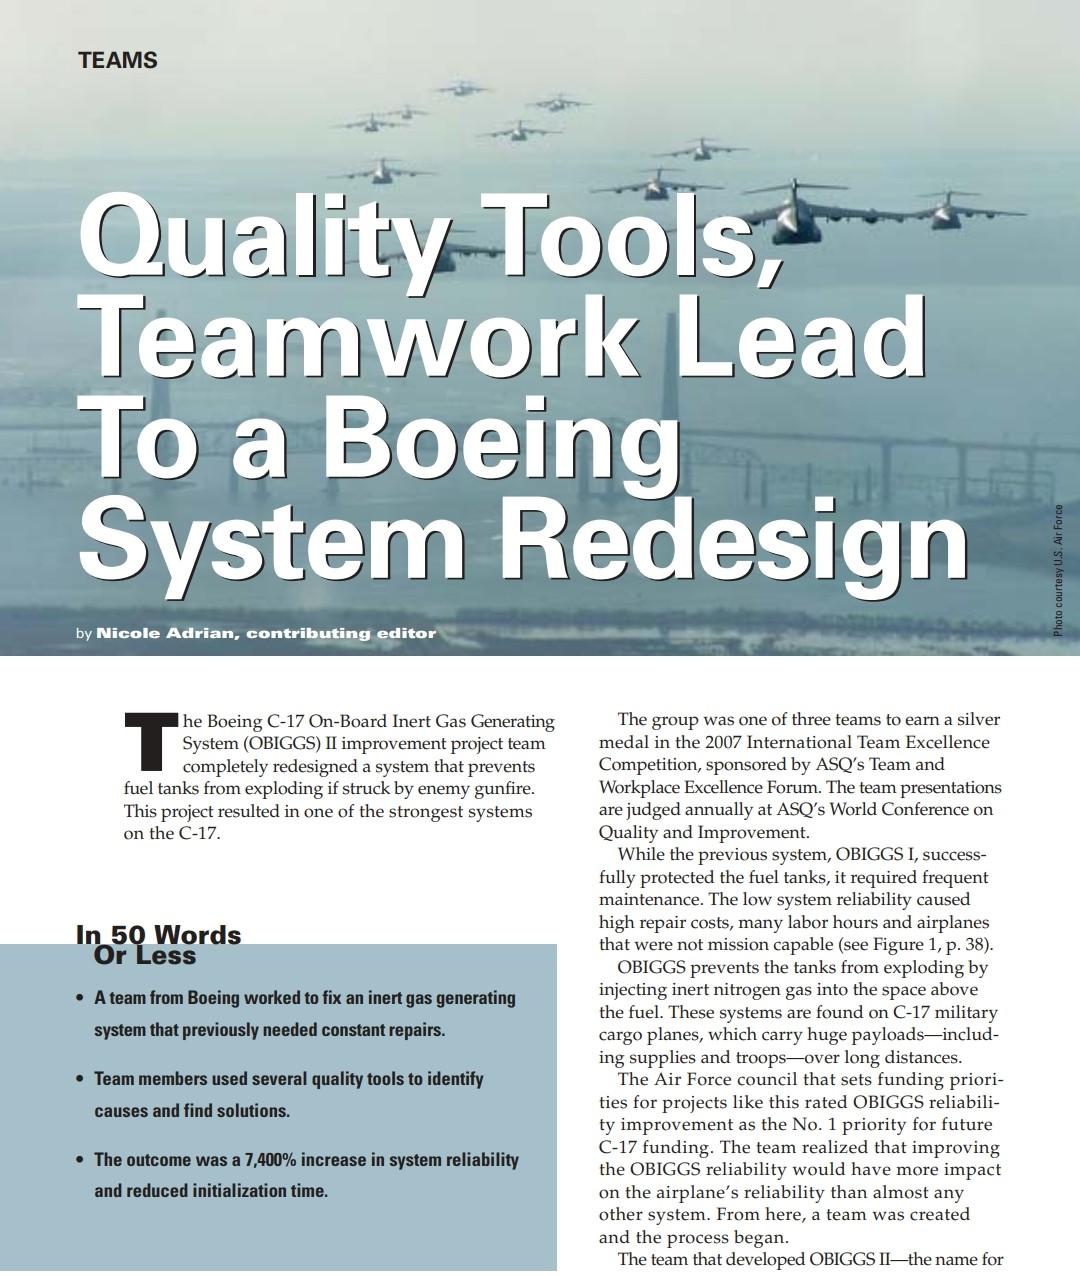
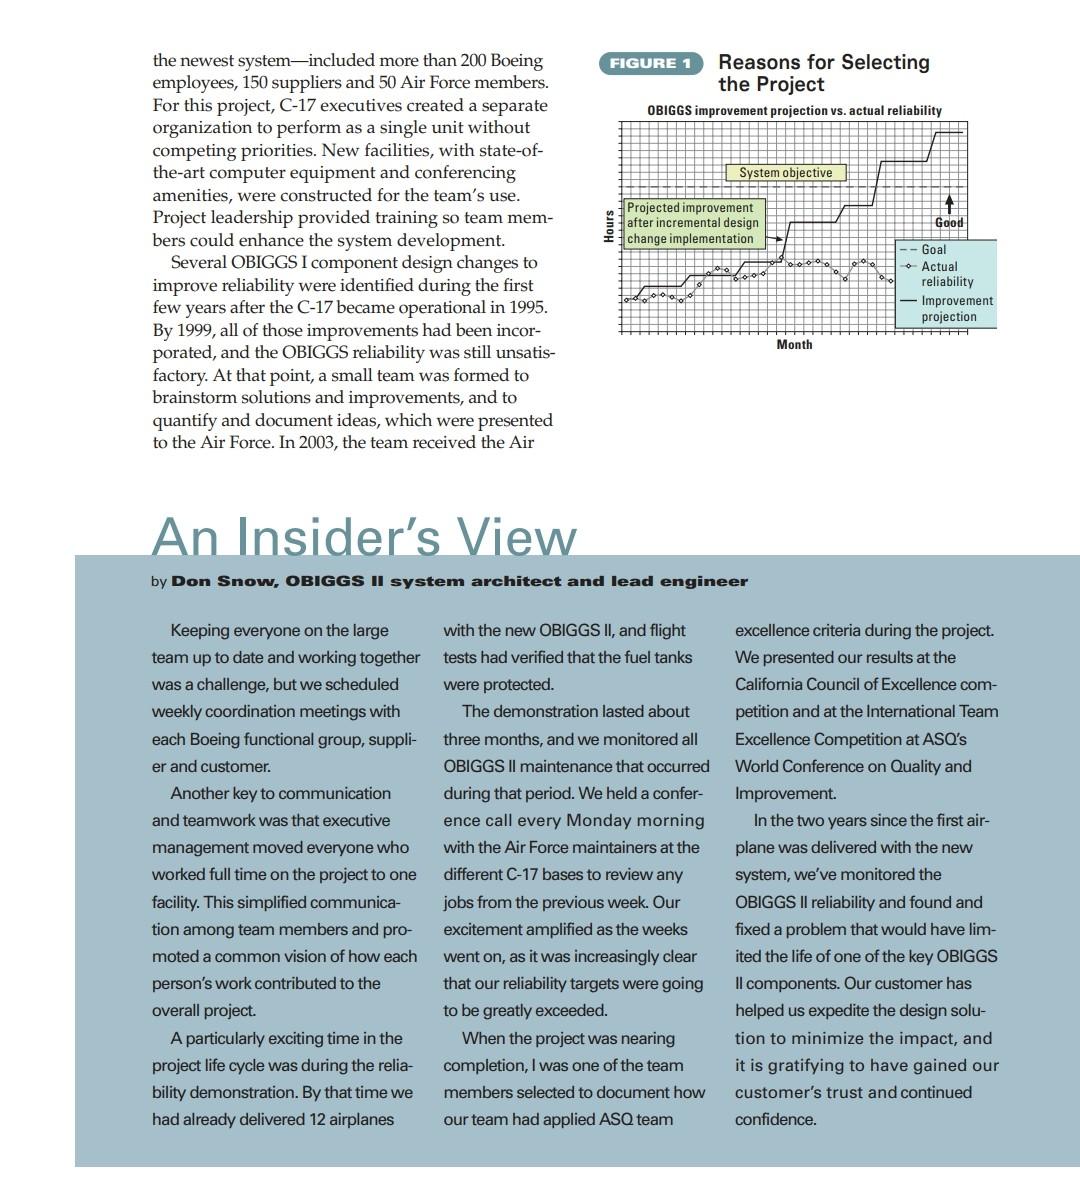
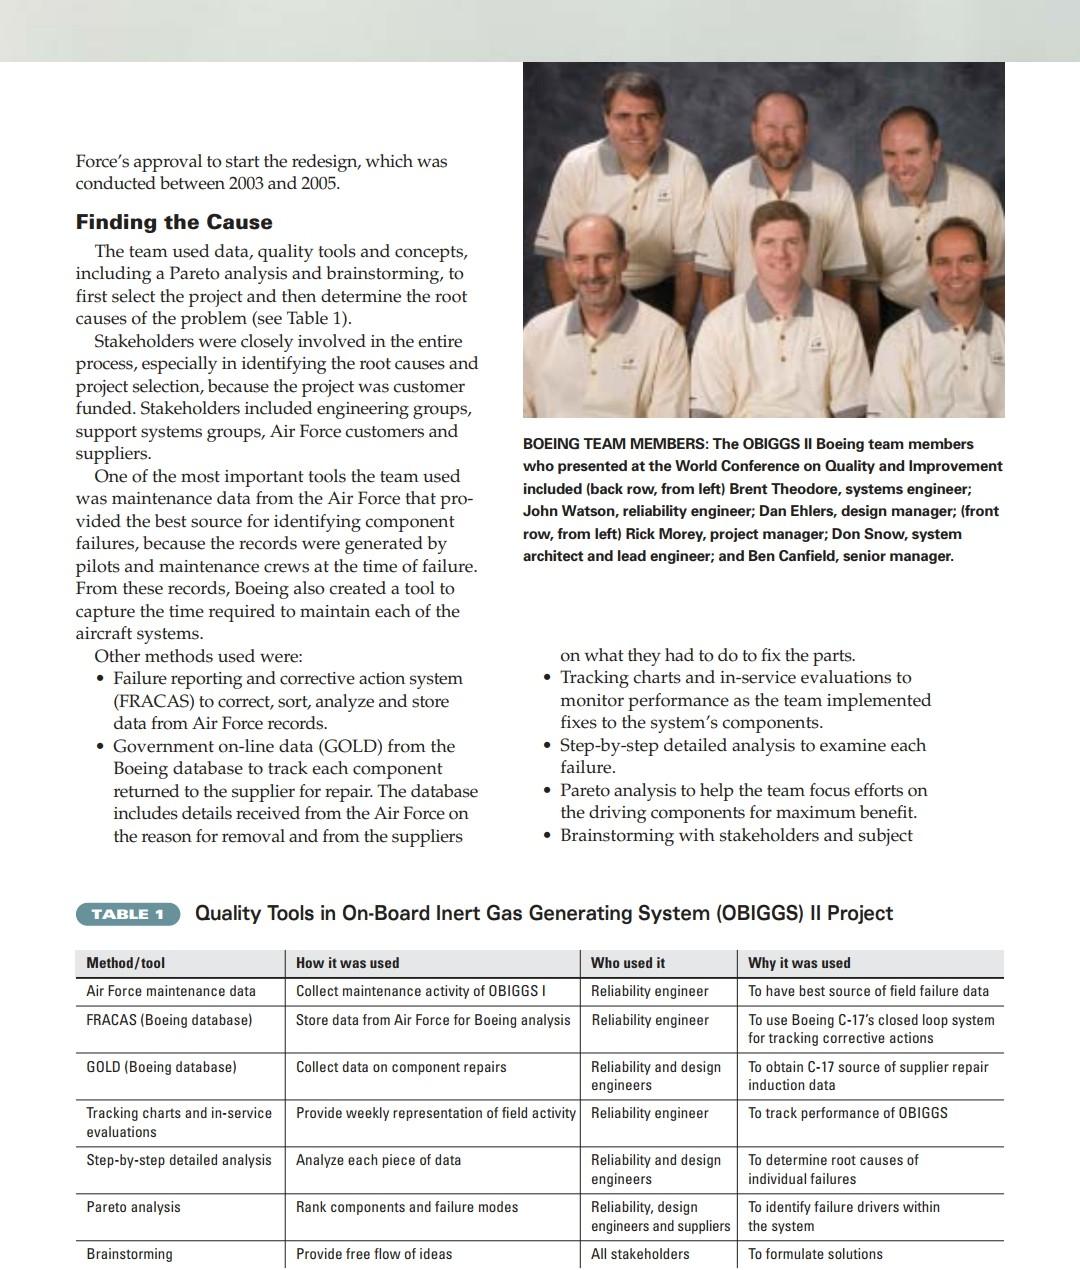
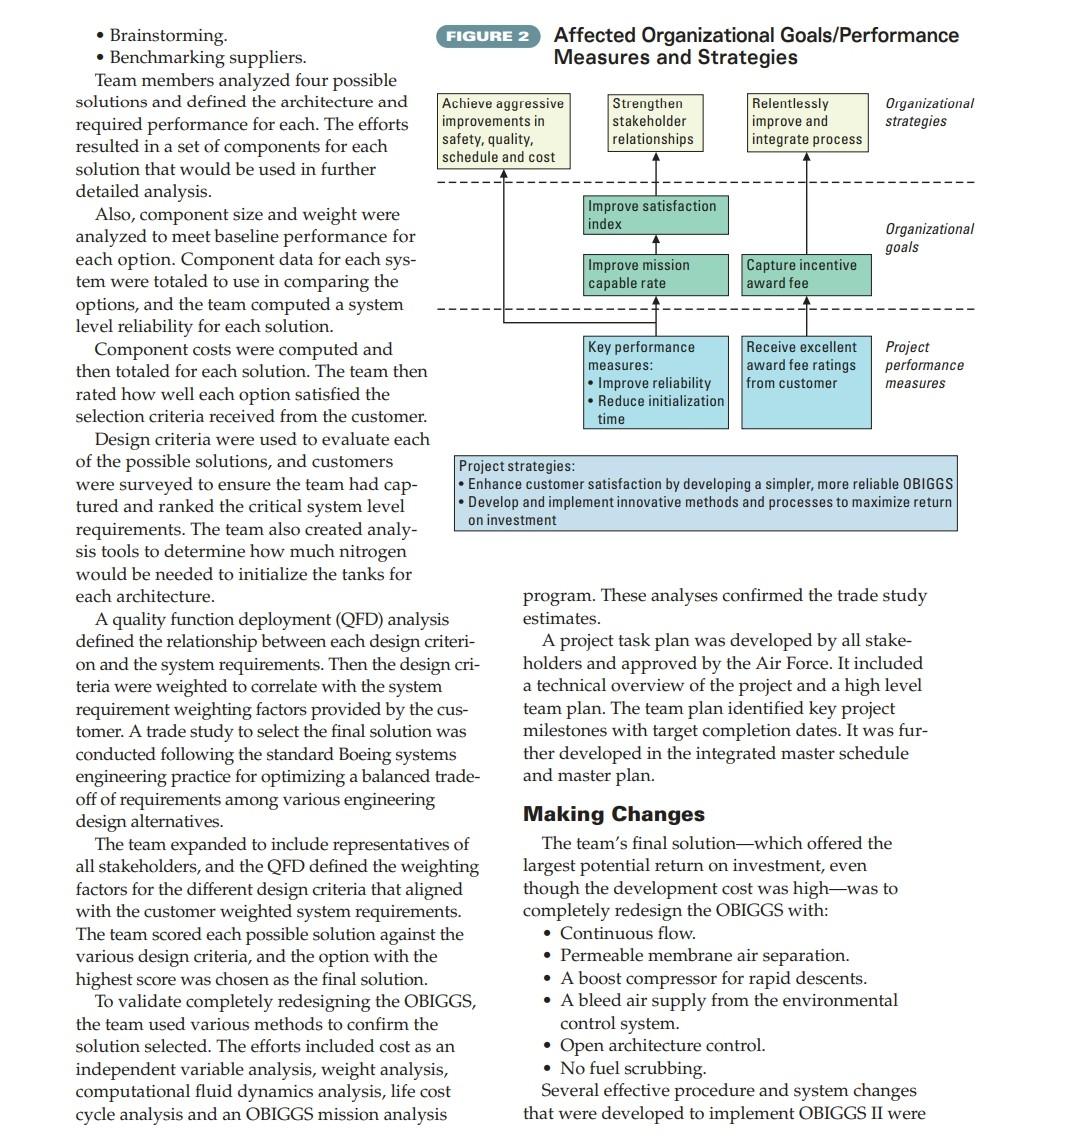
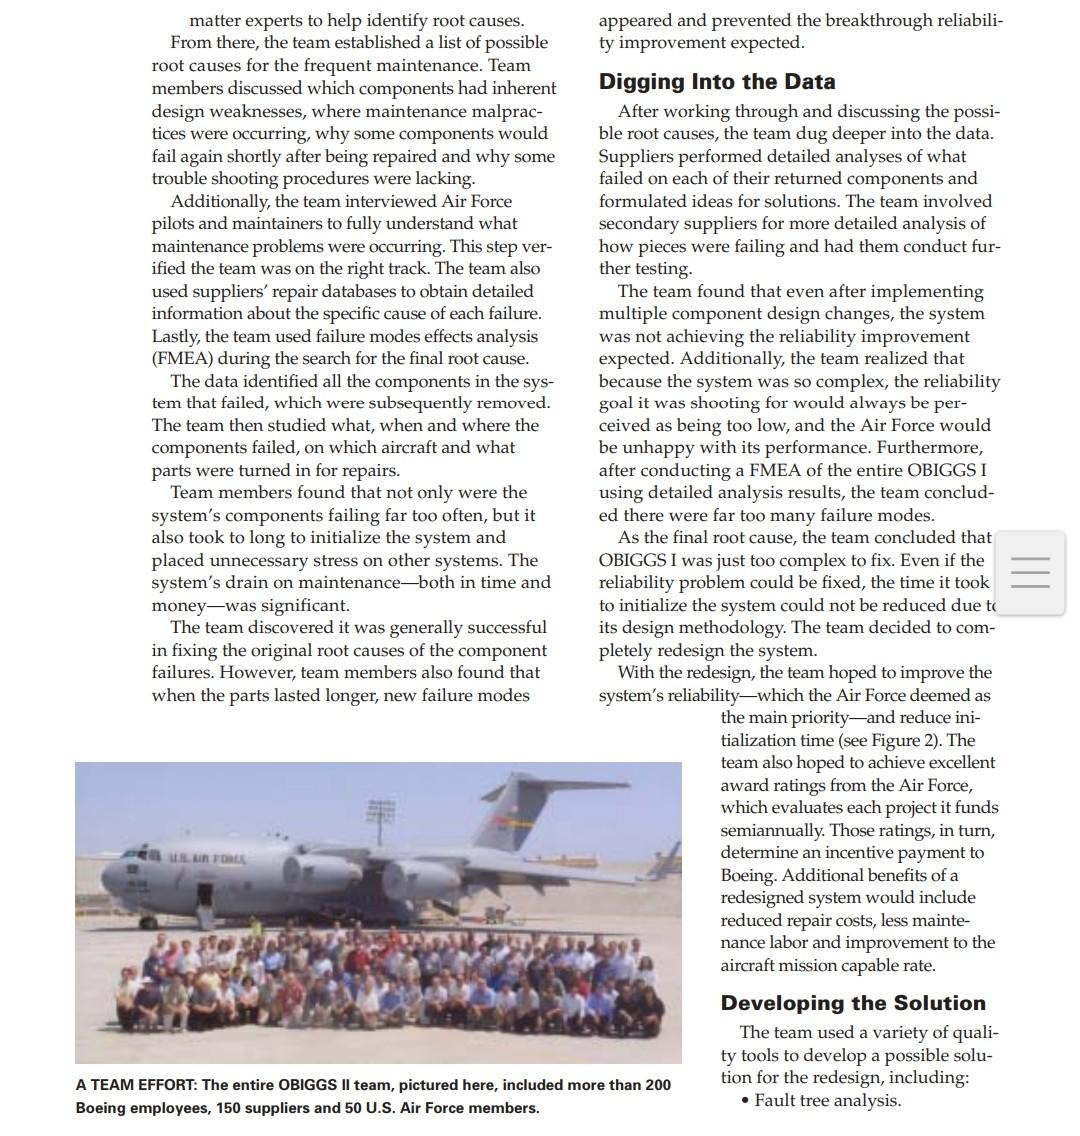
TEAMS Quality Tools, Teamwork Lead To a Boeing, System Redesign Photo courtesy U.S. Air Force by Nicole Adrian, contributing editor T The Boeing C-17 On-Board Inert Gas Generating System (OBIGGS) II improvement project team completely redesigned a system that prevents fuel tanks from exploding if struck by enemy gunfire. This project resulted in one of the strongest systems on the C-17. In 50 Words Or Less A team from Boeing worked to fix an inert gas generating system that previously needed constant repairs. The group was one of three teams to earn a silver medal in the 2007 International Team Excellence Competition, sponsored by ASQ's Team and Workplace Excellence Forum. The team presentations are judged annually at ASQ's World Conference on Quality and Improvement. While the previous system, OBIGGS I, success- fully protected the fuel tanks, it required frequent maintenance. The low system reliability caused high repair costs, many labor hours and airplanes that were not mission capable (see Figure 1, p. 38). OBIGGS prevents the tanks from exploding by injecting inert nitrogen gas into the space above the fuel. These systems are found on C-17 military cargo planes, which carry huge payloadsinclud- ing supplies and troops-over long distances. The Air Force council that sets funding priori- ties for projects like this rated OBIGGS reliabili- ty improvement as the No. 1 priority for future C-17 funding. The team realized that improving the OBIGGS reliability would have more impact on the airplane's reliability than almost any other system. From here, a team was created and the process began. The team that developed OBIGGS IIthe name for Team members used several quality tools to identify causes and find solutions. The outcome was a 7,400% increase in system reliability and reduced initialization time. FIGURE 1 Reasons for Selecting the Project OBIGGS improvement projection vs. actual reliability System objective Projected improvement after incremental design change implementation Good the newest system-included more than 200 Boeing employees, 150 suppliers and 50 Air Force members. For this project, C-17 executives created a separate organization to perform as a single unit without competing priorities. New facilities, with state-of- the-art computer equipment and conferencing amenities, were constructed for the team's use. Project leadership provided training so team mem- bers could enhance the system development. Several OBIGGS I component design changes to improve reliability were identified during the first few years after the C-17 became operational in 1995. By 1999, all of those improvements had been incor- porated, and the OBIGGS reliability was still unsatis- factory. At that point, a small team was formed to brainstorm solutions and improvements, and to quantify and document ideas, which were presented to the Air Force. In 2003, the team received the Air Goal Actual reliability Improvement projection 1200 Month An Insider's View by Don Snow, OBIGGS II system architect and lead engineer Keeping everyone on the large team up to date and working together was a challenge, but we scheduled weekly coordination meetings with each Boeing functional group, suppli- er and customer. Another key to communication and teamwork was that executive management moved everyone who worked full time on project to one facility. This simplified communica- tion among team members and pro- moted a common vision of how each person's work contributed to the overall project. A particularly exciting time in the project life cycle was during the relia- bility demonstration. By that time we had already delivered 12 airplanes with the new OBIGGS II, and flight tests had verified that the fuel tanks were protected. The demonstration lasted about three months, and we monitored all OBIGGS Il maintenance that occurred during that period. We held a confer- ence call every Monday morning with the Air Force maintainers at the different C-17 bases to review any jobs from the previous week. Our excitement amplified as the weeks went on, as it was increasingly clear that our reliability targets were going to be greatly exceeded. When the project was nearing completion, I was one of the team members selected to document how our team had applied ASQ team excellence criteria during the project. We presented our results at the California Council of Excellence com- petition and at the International Team Excellence Competition at ASQ's World Conference on Quality and Improvement. In the two years since the first air- plane was delivered with the new system, we've monitored OBIGGS II reliability and found and fixed a problem that would have lim- ited the life of one of the key OBIGGS Il components. Our customer has helped us expedite the design solu- tion to minimize the impact, and it is gratifying to have gained our customer's trust and continued confidence. Force's approval to start the redesign, which was conducted between 2003 and 2005. Finding the Cause The team used data, quality tools and concepts, including a Pareto analysis and brainstorming, to first select the project and then determine the root causes of the problem (see Table 1). Stakeholders were closely involved in the entire process, especially in identifying the root causes and project selection, because the project was customer funded. Stakeholders included engineering groups, support systems groups, Air Force customers and suppliers. One of the most important tools the team used was maintenance data from the Air Force that pro- vided the best source for identifying component failures, because the records were generated by pilots and maintenance crews at the time of failure. From these records, Boeing also created a tool to capture the time required to maintain each of the aircraft systems. Other methods used were: Failure reporting and corrective action system (FRACAS) to correct, sort, analyze and store data from Air Force records. Government on-line data (GOLD) from the Boeing database to track each component returned to the supplier for repair. The database includes details received from the Air Force on the reason for removal and from the suppliers BOEING TEAM MEMBERS: The OBIGGS II Boeing team members who presented at the World Conference on Quality and Improvement included (back row, from left) Brent Theodore, systems engineer; John Watson, reliability engineer, Dan Ehlers, design manager; (front row, from left) Rick Morey, project manager; Don Snow, system architect and lead engineer; and Ben Canfield, senior manager. on what they had to do to fix the parts. Tracking charts and in-service evaluations to monitor performance as the team implemented fixes to the system's components. Step-by-step detailed analysis to examine each failure. Pareto analysis to help the team focus efforts on the driving components for maximum benefit. Brainstorming with stakeholders and subject TABLE 1 Quality Tools in On-Board Inert Gas Generating System (OBIGGS) II Project Method/tool How it was used Who used it Why it was used To have best source of field failure data Air Force maintenance data Collect maintenance activity of OBIGGSI Store data from Air Force Boeing analysis Reliability engineer Reliability engineer FRACAS (Boeing database) GOLD (Boeing database) Collect data on component repairs Reliability and design engineers Provide weekly representation of field activity Reliability engineer To use Boeing C-17's closed loop system for tracking corrective actions To obtain C-17 source of supplier repair induction data To track performance of OBIGGS Tracking charts and in-service evaluations Step-by-step detailed analysis Analyze each piece of data Pareto analysis Rank components and failure modes Reliability and design To determine root causes of engineers individual failures Reliability, design To identify failure drivers within engineers and suppliers the system All stakeholders To formulate solutions Brainstorming Provide free flow of ideas Brainstorming. FIGURE 2 Affected Organizational Goals/Performance Benchmarking suppliers. Measures and Strategies Team members analyzed four possible solutions and defined the architecture and Achieve aggressive Strengthen Relentlessly Organizational required performance for each. The efforts improvements in stakeholder improve and strategies resulted in a set of components for each safety, quality, relationships integrate process schedule and cost solution that would be used in further detailed analysis. Improve satisfaction Also, component size and weight were index analyzed to meet baseline performance for Organizational goals each option. Component data for each sys- Improve mission Capture incentive tem were totaled to use in comparing the capable rate award fee options, and the team computed a system level reliability for each solution. Component costs were computed and Key performance Receive excellent Project then totaled for each solution. The team then measures: award fee ratings performance Improve reliability from customer measures rated how well each option satisfied the Reduce initialization selection criteria received from the customer. time Design criteria were used to evaluate each of the possible solutions, and customers Project strategies: were surveyed to ensure the team had cap- Enhance customer satisfaction by developing a simpler, more reliable OBIGGS tured and ranked the critical system level Develop and implement innovative methods and processes to maximize return on investment requirements. The team also created analy- sis tools to determine how much nitrogen would be needed to initialize the tanks for each architecture. program. These analyses confirmed the trade study A quality function deployment (QFD) analysis estimates. defined the relationship between each design criteri- A project task plan was developed by all stake- on and the system requirements. Then the design cri- holders and approved by the Air Force. It included teria were weighted to correlate with the system a technical overview of the project and a high level requirement weighting factors provided by the cus- team plan. The team plan identified key project tomer. A trade study to select the final solution was milestones with target completion dates. It was fur- conducted following the standard Boeing systems ther developed in the integrated master schedule engineering practice for optimizing a balanced trade- and master plan. off of requirements among various engineering design alternatives. Making Changes The team expanded to include representatives of The team's final solutionwhich offered the all stakeholders, and the QFD defined the weighting largest potential return on investment, even factors for the different design criteria that aligned though the development cost was high-was to with the customer weighted system requirements. completely redesign the OBIGGS with: The team scored each possible solution against the Continuous flow. various design criteria, and the option with the Permeable membrane air separation. highest score was chosen as the final solution. A boost compressor for rapid descents. To validate completely redesigning the OBIGGS, A bleed air supply from the environmental the team used various methods to confirm the control system. solution selected. The efforts included cost as an Open architecture control. independent variable analysis, weight analysis, No fuel scrubbing computational fluid dynamics analysis, life cost Several effective procedure and system changes cycle analysis and an OBIGGS mission analysis that were developed to implement OBIGGS II were . matter experts to help identify root causes. appeared and prevented the breakthrough reliabili- From there, the team established a list of possible ty improvement expected. root causes for the frequent maintenance. Team members discussed which components had inherent Digging Into the Data design weaknesses, where maintenance malprac- After working through and discussing the possi- tices were occurring, why some components would ble root causes, the team dug deeper into the data. fail again shortly after being repaired and why some Suppliers performed detailed analyses of what trouble shooting procedures were lacking. failed on each of their returned components and Additionally, the team interviewed Air Force formulated ideas for solutions. The team involved pilots and maintainers to fully understand what secondary suppliers for more detailed analysis of maintenance problems were occurring. This step ver- how pieces were failing and had them conduct fur- ified the team was on the right track. The team also ther testing. used suppliers' repair databases to obtain detailed The team found that even after implementing information about the specific cause of each failure. multiple component design changes, the system Lastly, the team used failure modes effects analysis was not achieving the reliability improvement (FMEA) during the search for the final root cause. expected. Additionally, the team realized that The data identified all the components in the sys- because the system was so complex, the reliability tem that failed, which were subsequently removed. goal it was shooting for would always be per- The team then studied what, when and where the ceived as being too low, and the Air Force would components failed, on which aircraft and what be unhappy with its performance. Furthermore, parts were turned in for repairs. after conducting a FMEA of the entire OBIGGS I Team members found that not only were the using detailed analysis results, the team conclud- system's components failing far too often, but it ed there were far too many failure modes. also took to long to initialize the system and As the final root cause, the team concluded that placed unnecessary stress on other systems. The OBIGGS I was just too complex to fix. Even if the system's drain on maintenanceboth in time and reliability problem could be fixed, the time it took money-was significant. to initialize the system could not be reduced due to The team discovered it was generally successful its design methodology. The team decided to com- in fixing the original root causes of the component pletely redesign the system. failures. However, team members also found that With the redesign, the team hoped to improve the when the parts lasted longer, new failure modes system's reliabilitywhich the Air Force deemed as the main priorityand reduce ini- tialization time (see Figure 2). The team also hoped to achieve excellent award ratings from the Air Force, which evaluates each project it funds semiannually. Those ratings, in turn, ER FOR determine an incentive payment to Boeing. Additional benefits of a redesigned system would include reduced repair costs, less mainte- nance labor and improvement to the aircraft mission capable rate. Developing the Solution The team used a variety of quali- ty tools to develop a possible solu- A TEAM EFFORT: The entire OBIGGS Il team, pictured here, included more than 200 tion for the redesign, including: Boeing employees, 150 suppliers and 50 U.S. Air Force members. Fault tree analysis. sustained throughout the project, including draw- ing quality inspection, production tag-up database and reliability evaluation plan. Some have even been adopted by other projects. The teams used both existing and new systems to measure and sustain project results. Project specific reports and metrics were developed to measure parameters for such activities as engineering draw- ing creation, technical manual creation and part procurement. Performance and schedule tools were integrated into one common instrument, which the stakehold- ers updated weekly. It was used to manage the project and provide reports to executive leadership and the customer. . Exceeding Expectations After several planes with OBIGGS II were deliev- ered, a new reliability evaluation verified that relia- bility targets were met. Each week, the team reviewed the actual reliability data for the in-ser- vice airplanes. The tangible and intangible results greatly exceeded everyone's expectations for the system. They were: Increased system reliability by 7,400%. Reduced initialization time by a factor of 11. Reduced weight by 517 pounds, allowing for increased cargo capacity. A 20% system and 3:1 life cycle cost savings. Improved customer satisfaction and strength- ened stakeholder relationships. Becoming the industry leader in inerting sys- tem design. Incorporation of an open architecture design that reduced the cost of future improvements. Achievement of aggressive financial improve- ment by reducing logistic and production costs, and of earning of excellent ratings during all award fee periods. The team regularly communi- cated the results with stakehold- ers through meetings, reviews and flight test reports. At the end, the team met cost, schedule and performance targets, and the total cost of the project came in 0.5% under budget. The open communication stressed throughout the process was key to the project's success. Additionally, team member com- mitment and ownership promoted the common goal of delivering an OBIGGS to the customer that would meet or exceed the required performance measures. The result? A sense of unity and teamwork that enabled members to set new benchmarks for project success. SAI GLOBAL Thinking Business ... Driving Improvement There is light at the end of the tunnel ... NOTE with SAI Global's Training, Auditing & Certification Services For course dates & locations or to learn more about auditing & certification services: V Look for case studies on the other three winning projects from the 2007 International Team Excellence Competition in past and future issues of Quality Progress. Call Visit 800-374-3818 www.saiglobal.comStep by Step Solution
There are 3 Steps involved in it
1 Expert Approved Answer
Step: 1 Unlock

Question Has Been Solved by an Expert!
Get step-by-step solutions from verified subject matter experts
Step: 2 Unlock
Step: 3 Unlock