

Question: Construct a 95% confidence interval for (mu_{1}-mu_{2}) using the data presented in Table 3. Approach The normal probability plots and boxplot (Figure 10) indicate that
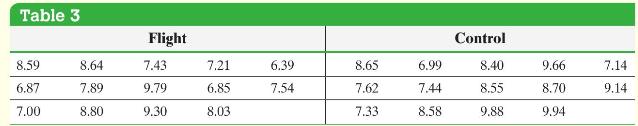
Construct a 95% confidence interval for \(\mu_{1}-\mu_{2}\) using the data presented in Table 3.
Approach The normal probability plots and boxplot (Figure 10) indicate that the data are approximately normal with no outliers. Construct the confidence interval with \(\alpha=0.05\) using Formula (3) or using technology.
Formula 3
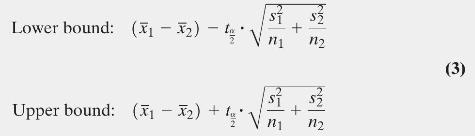
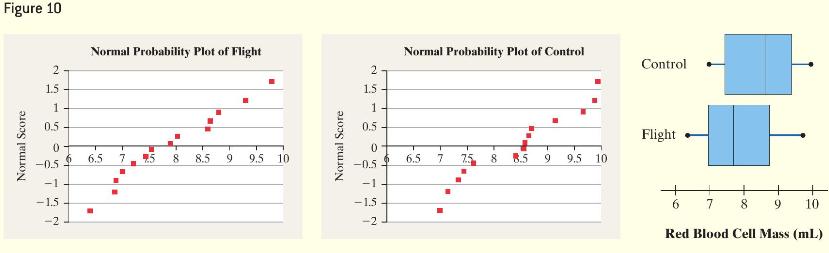
Table 3 Flight Control 8.59 8.64 7.43 7.21 6.39 8.65 6.99 8.40 9.66 7.14 6.87 7.89 9.79 6.85 7.54 7.62 7.44 8.55 8.70 9.14 7.00 8.80 9.30 8.03 7.33 8.58 9.88 9.94
Step by Step Solution
3.40 Rating (162 Votes )
There are 3 Steps involved in it
By Hand We have already found the sample statistics In addition we f... View full answer

Get step-by-step solutions from verified subject matter experts