

Question: Draw a dot plot for the number of arrivals at Wendys data from Table 8. Approach The smallest observation in the data set is 1
Draw a dot plot for the number of arrivals at Wendy’s data from Table 8.
Approach The smallest observation in the data set is 1 and the largest is 11. Write the numbers 1 through 11 horizontally. For each observation, place a dot above the value of the observation.
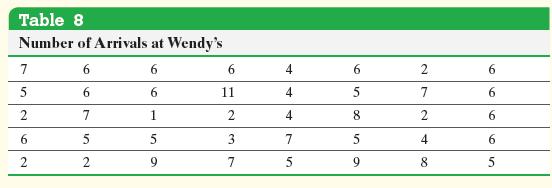
Table 8 Number of Arrivals at Wendy's 7 6 6 6 4 6 2 6 5 6 6 11 4 5 7 6 2 7 1 2 4 8 2 6 6. 5 5 3 7 5 4 6 2 2 9 7 5 9 8 5
Step by Step Solution
★★★★★
3.41 Rating (160 Votes )
There are 3 Steps involved in it
1 Expert Approved Answer
Step: 1 Unlock

Figur... View full answer
Question Has Been Solved by an Expert!
Get step-by-step solutions from verified subject matter experts
Step: 2 Unlock
Step: 3 Unlock