

Question: Construct a stem-and-leaf plot of the poverty data discussed in Example 6. Approach We will use Minitab. The steps for constructing the graphs using Minitab
Construct a stem-and-leaf plot of the poverty data discussed in Example 6.
Approach We will use Minitab. The steps for constructing the graphs using Minitab or StatCrunch are given in the Technology Step-by-Step.
The TI graphing calculators and Excel are not capable of drawing stem-and-leaf plots.
Data from Example 6
The data in Table 14 represent the two-year average percentage of persons
living in poverty, by state, for the years 2012–2013. Draw a stem-and-leaf plot of the
data.
Approach
Step 1 Treat the integer portion of the number as the stem and the decimal portion
as the leaf. For example, the stem for Alabama will be 16 and the leaf will be 4. The
stem of 16 will include all data from 16.0 to 16.9.
Step 2 Write the stems vertically in ascending order, and then draw a vertical line to the right of the stems.
Step 3 Write the leaves corresponding to the stem.
Step 4 Within each stem, rearrange the leaves in ascending order. Title the plot and
include a legend to indicate what the values represent.
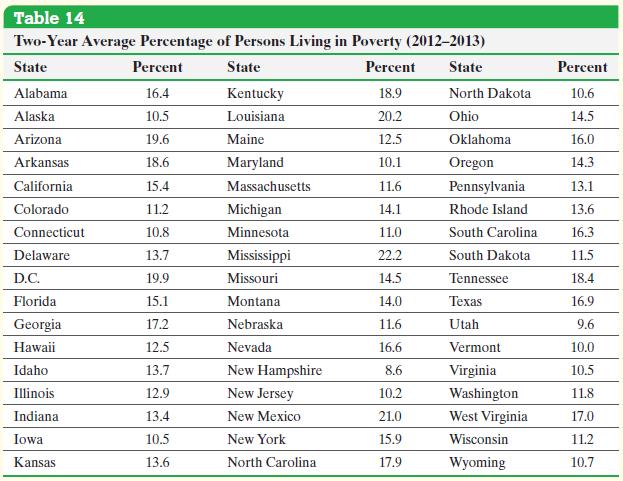
Table 14 Two-Year Average Percentage of Persons Living in Poverty (2012-2013) State Percent State Percent State Percent Alabama 16.4 Kentucky 18.9 North Dakota 10.6 Alaska 10.5 Louisiana 20.2 Ohio 14.5 Arizona 19.6 Maine 12.5 Oklahoma 16.0 Arkansas 18.6 Maryland 10.1 Oregon 14.3 California 15.4 Massachusetts 11.6 Pennsylvania 13.1 Colorado 11.2 Michigan 14.1 Rhode Island 13.6 Connecticut 10.8 Minnesota 11.0 South Carolina 16.3 Delaware 13.7 Mississippi 22.2 South Dakota 11.5 D.C. 19.9 Missouri 14.5 Tennessee 18.4 Florida 15.1 Montana 14.0 Texas 16.9 Georgia 17.2 Nebraska 11.6 Utah 9.6 Hawaii 12.5 Nevada 16.6 Vermont 10.0 Idaho 13.7 New Hampshire 8.6 Virginia 10.5 Illinois 12.9 New Jersey 10.2 Washington 11.8 Indiana 13.4 New Mexico 21.0 West Virginia 17.0 Iowa 10.5 New York 15.9 Wisconsin 11.2 Kansas 13.6 North Carolina 17.9 Wyoming 10.7
Step by Step Solution
3.45 Rating (145 Votes )
There are 3 Steps involved in it
Figure 11 on the ... View full answer

Get step-by-step solutions from verified subject matter experts