

Question: Find the least-squares regression line for the data in Table 2 from Section 4.1. Approach We found Substitute the values in Formulas (2) and (3)
Find the least-squares regression line for the data in Table 2 from Section 4.1.
Approach We found
![]()
Substitute the values in Formulas (2) and (3) to find the slope and intercept of the least-squares regression line.
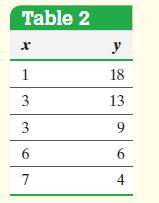
Data from Table 2 section 4.1
Formulas

![]()
r = -0.946, x = 4, sx = 2.44949, y = 10, and sy = 5.612486
Step by Step Solution
★★★★★
3.52 Rating (172 Votes )
There are 3 Steps involved in it
1 Expert Approved Answer
Step: 1 Unlock

Question Has Been Solved by an Expert!
Get step-by-step solutions from verified subject matter experts
Step: 2 Unlock
Step: 3 Unlock