

Question: Use the golf data in Table 5. (a) Find the least-squares regression line. (b) Draw the least-squares regression line on the scatter diagram of the
Use the golf data in Table 5.
(a) Find the least-squares regression line.
(b) Draw the least-squares regression line on the scatter diagram of the data.
(c) Predict the distance a golf ball will travel when hit with a club-head speed of 103 miles per hour (mph).
(d) Determine the residual for the predicted value found in part (c). Is the distance in Table 5 above average or below average among all balls hit with a swing speed of 103 mph?
Approach Because technology plays a role in obtaining the least-squares regression line, we will use a TI-84 Plus C graphing calculator, Minitab, Excel, and StatCrunch to obtain the least-squares regression line. The steps for obtaining regression lines are given in the Technology Step-by-Step.
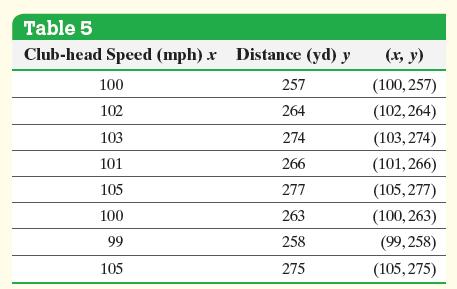
Table 5 Club-head Speed (mph) x Distance (yd) y (x, y) 100 257 (100,257) 102 264 (102,264) 103 274 (103,274) 101 266 (101,266) 105 277 (105,277) 100 263 (100, 263) 99 258 (99,258) 105 275 (105,275)
Step by Step Solution
3.45 Rating (158 Votes )
There are 3 Steps involved in it

Get step-by-step solutions from verified subject matter experts