

Question: Interpret the regression coefficients for the least-squares regression equation found in Example 2. Approach Interpret the coefficients the same way as we did for a
Interpret the regression coefficients for the least-squares regression equation found in Example 2.
Approach Interpret the coefficients the same way as we did for a regression with one explanatory variable. However, assume that the remaining explanatory variables are constant.
Data from Example 2
Use the data in Table 4.
Find the least-squares regression equation \(\hat{y}=b_{0}+b_{1} x_{1}+b_{2} x_{2}\), where \(x_{1}\) represents the patient's age, \(x_{2}\) represents the patient's daily consumption of saturated fat, and \(y\) represents the patient's total cholesterol.
Draw residual plots and a boxplot of the residuals to assess the adequacy of the model.
Enter the data into Minitab to obtain the least-squares regression equation and to draw the residual plots and boxplot of the residuals. The steps for determining the multiple regression equation and residual plots using Minitab, Excel, and StatCrunch are given in the Technology Step-by-Step.
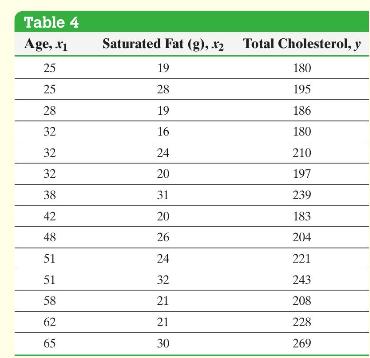
Table 4 Age, .x1 Saturated Fat (g), x2 Total Cholesterol, y 25 25 19 180 28 195 28 19 186 32 16 180 32 24 210 32 20 197 38 31 239 42 20 183 48 26 204 51 24 221 51 32 243 58 21 208 62 21 228 65 30 269
Step by Step Solution
3.44 Rating (151 Votes )
There are 3 Steps involved in it

Get step-by-step solutions from verified subject matter experts