

Question: is ascatterplotofU.S.statewidedatacompiledbetween x = per- centagewearingmasksand y = percentageknowingsomeonewithCovid-19symptoms. Whichdoyouthinkbestdescribesthescatterplot? (a) Correlation = 0.85 andpredicted y = Percentage knowing Covid-19 sufferer 10 15 20 25
is ascatterplotofU.S.statewidedatacompiledbetween x = per-
centagewearingmasksand y = percentageknowingsomeonewithCovid-19symptoms.
Whichdoyouthinkbestdescribesthescatterplot?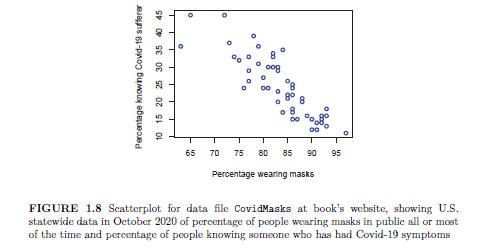
(a) Correlation = −0.85 andpredicted y =
Percentage knowing Covid-19 sufferer 10 15 20 25 30 35 40 45 65 70 75 80 85 Percentage wearing masks 90 95 FIGURE 1.8 Scatterplot for data file CovidMasks at book's website, showing U.S. statewide data in October 2020 of percentage of people wearing masks in public all or most of the time and percentage of people knowing someone who has had Covid-19 symptoms
Step by Step Solution
There are 3 Steps involved in it
1 Expert Approved Answer
Step: 1 Unlock

Question Has Been Solved by an Expert!
Get step-by-step solutions from verified subject matter experts
Step: 2 Unlock
Step: 3 Unlock