

Question: One graph in the figure below represents a normal distribution with mean = 8 and standard deviation = 2. The other graph represents
One graph in the figure below represents a normal distribution with mean μ = 8 and standard deviation σ = 2. The other graph represents a normal distribution with mean μ = 14 and standard deviation σ = 2.
Determine which graph is which and explain how you know.
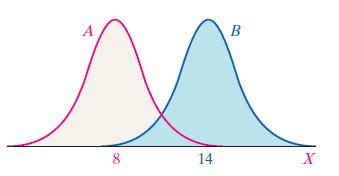
A B 8 14 X
Step by Step Solution
★★★★★
3.44 Rating (154 Votes )
There are 3 Steps involved in it
1 Expert Approved Answer
Step: 1 Unlock

Distributions are given Distribution 1 Mean 1 1 8 Standard deviation 1 1 2 Distribution 2 Mean 2 2 ... View full answer
Question Has Been Solved by an Expert!
Get step-by-step solutions from verified subject matter experts
Step: 2 Unlock
Step: 3 Unlock