

Question: The graph of a normal curve is given. Use the graph to identify the values of and . -7-4-1 2 5 8 11 X
The graph of a normal curve is given. Use the graph to identify the values of μ and σ.
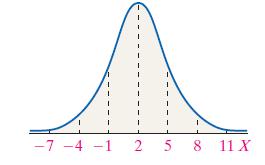
-7-4-1 2 5 8 11 X
Step by Step Solution
★★★★★
3.39 Rating (155 Votes )
There are 3 Steps involved in it
1 Expert Approved Answer
Step: 1 Unlock

From the graph of a normal curve a The MEAN is always located at the p... View full answer
Question Has Been Solved by an Expert!
Get step-by-step solutions from verified subject matter experts
Step: 2 Unlock
Step: 3 Unlock