

Question: The bar graph illustrated in Figure 27 is a USA Today-type graph. A survey was conducted by Impulse Research for Quilted Northern Confidential in which
The bar graph illustrated in Figure 27 is a USA Today-type graph. A survey was conducted by Impulse Research for Quilted Northern Confidential in which individuals were asked how they would flush a toilet when the facilities are not sanitary.
What’s wrong with the graphic?
Approach Compare the vertical scales of each bar to see if they accurately depict the given percentages.
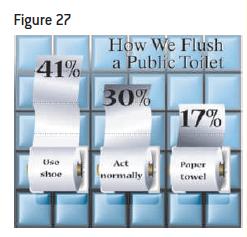
Figure 27 41% How We Flush a Public Toilet 30% 17% Use shoe Act normally Paper towel
Step by Step Solution
There are 3 Steps involved in it
First it is unclear whether the bars include the rol... View full answer

Get step-by-step solutions from verified subject matter experts