

Question: Use statistical software or a calculator to determine the population standard deviation of the data listed in Table 8 and the sample standard deviation of
Use statistical software or a calculator to determine the population standard deviation of the data listed in Table 8 and the sample standard deviation of the sample data from Example 4.
Approach We will use a TI-84 Plus C graphing calculator. The steps for determining the standard deviation using the TI-83 or TI-84 Plus graphing calculator, Minitab, Excel, and StatCrunch are given in the Technology Step-by-Step.
Data from Example 4
Compute the sample standard deviation of the sample obtained in Example 1 (b) from Section 3.1.
Data from Example 1 Section 3.1.
The data in Table 1 represent the first exam score of 10 students enrolled in Introductory Statistics. Treat the 10 students as a population.
(a) Compute the population mean.
(b) Find a simple random sample of size n = 4 students.
(c) Compute the sample mean of the sample found in part (b).
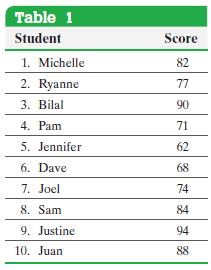
Table 1 Student Score 1. Michelle 82 2. Ryanne 77 3. Bilal 90 4. Pam 71 5. Jennifer 62 6. Dave 68 7. Joel 74 8. Sam 84 9. Justine 94 10. Juan 88
Step by Step Solution
3.49 Rating (159 Votes )
There are 3 Steps involved in it
Figure 11 a shows the population standard deviation and Figure 11 b shows the ... View full answer

Get step-by-step solutions from verified subject matter experts