

Question: The data in Table 1.17 consist of 25 values for four computer-generated variables called Y1, Y2, Y3, and Y4. Each of these is intended to
The data in Table 1.17 consist of 25 values for four computer-generated variables called Y1, Y2, Y3, and Y4. Each of these is intended to represent a particular distributional shape. Use a stem and leaf and a box plot to ascertain the nature of each distribution and then see whether the empirical rule works for each of these.
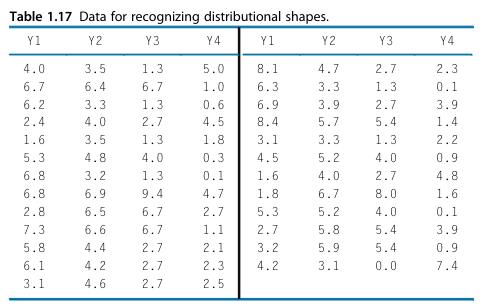
Table 1.17 Data for recognizing distributional shapes. Y1 Y2 Y3 Y4 Y1 Y2 Y3 Y4 4.0 3.5 1.3. 5.0 8.1 4.7 2.7 2.3 6.7 6.4 6.7 1.0 6.3 3.3 1.3 0.1 6.2 3.3 1.3 0.6 6.9 3.9 2.7 3.9 2.4 4.0 2.7 4.5 8.4 5.7 5.4 1.4 1.6 3.5 1.3 1.8 3.1 3.3 1.3 2.2 5.3 4.8 4.0 0.3 4.5 5.2 4.0 0.9 6.8 3.2 1.3 0.1 1.6 4.0 2.7 4.8 6.8 6.9 9.4 4.7 1.8. 6.7 8.0 1.6 2.8 6.5 6.7 2.7 5.3 5.2 4.0 0.1 7.3 6.6 6.7 1.1 2.7 5.8. 5.4 3.9 5.8 4.4 2.7 2.1 3.2 5.9 5.4 0.9 6.1 4.2 2.7 2.3 4.2 3.1 0.0 7.4 3.1 4.6 2.7 2.5
Step by Step Solution
3.46 Rating (153 Votes )
There are 3 Steps involved in it

Get step-by-step solutions from verified subject matter experts