

Question: Climatological records provide a rich source of data suitable for description by statistical methods. The data for this example (Table 1.18) are the number of
Climatological records provide a rich source of data suitable for description by statistical methods. The data for this example (Table 1.18) are the number of January days in London, England, having rain (Days) and the average January temperature (Temp, in degrees Fahrenheit) for the years 1858 through 1939.
(a) Summarize these two variables.
(b) Draw a scatterplot to see whether the two variables are related.
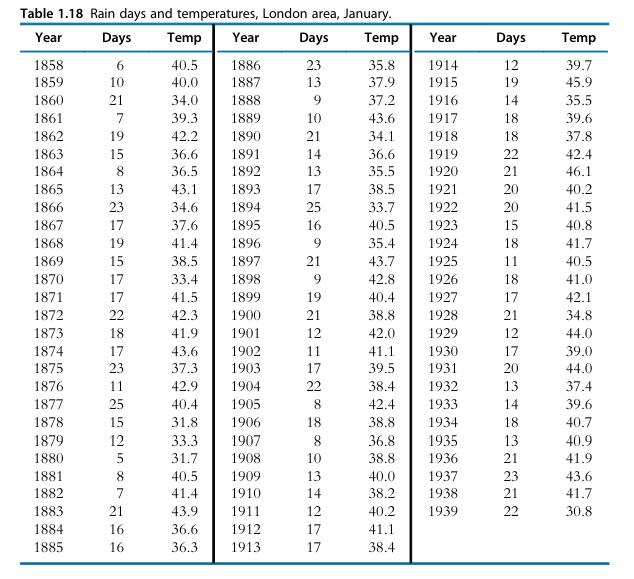
Table 1.18 Rain days and temperatures, London area, January. Year Days Temp Year Days Temp Year Days Temp 1858 6 40.5 1886 23 1859 10 40.0 1887 22 35.8 1914 12 39.7 13 37.9 1915 19 45.9 1860 21 34.0 1888 9 37.2 1916 14 35.5 1861 7 39.3 1889 10 43.6 1917 18 39.6 1862 19 42.2 1890 21 34.1 1918 18 37.8 1863 15 36.6 1891 14 36.6 1919 22 42.4 1864 8 36.5 1892 13 35.5 1920 21 46.1 1865 13 43.1 1893 17 38.5 1921 20 40.2 1866 23 34.6 1894 25 33.7 1922 20 41.5 1867 17 37.6 1895 16 40.5 1923 15 40.8 1868 19 41.4 1896 9 35.4 1924 18 41.7 1869 15 38.5 1897 21 43.7 1925 11 40.5 1870 17 33.4 1898. 9 42.8 1926 18 41.0 1871 17 41.5 1899 19 40.4 1927 17 42.1 1872 22 42.3 1900 21 38.8 1928 21 34.8 1873 18 41.9 1901 12 42.0 1929 12 44.0 1874 17 43.6 1902 11 41.1 1930 17 39.0 1875 23 37.3 1903 17 39.5 1931 20 44.0 1876 11 42.9 1904 22 38.4 1932 13 37.4 1877 25 40.4 1905 8 42.4 1933 14 39.6 1878 15 31.8 1906 18 38.8 1934 18 40.7 1879 12 33.3 1907 8 36.8 1935 13 40.9 1880 5 31.7 1908 10 38.8 1936 21 41.9 1881 8 40.5 1909 13 40.0 1937 23 43.6 1882 7 41.4 1910 14 38.2 1938 21 41.7 1883 21 43.9 1911 12 40.2 1939 22 30.8 1884 16 36.6 1912 17 41.1 1885 16 36.3 1913 17 38.4
Step by Step Solution
There are 3 Steps involved in it

Get step-by-step solutions from verified subject matter experts