

The data in Table 13 show the admission status and gender of students who applied to the
Question:
The data in Table 13 show the admission status and gender of students who applied to the University of California, Berkeley. From the data in Table 13, the proportion of accepted applications is 1748/4425 = 0.395. The proportion of accepted men is 1191/2590 = 0.460 and the proportion of accepted women is 557/1835 = 0.304. On the basis of these proportions, a gender bias suit was brought against the university. The university was shocked and claimed that program of study is a lurking variable that created the apparent association between admission status and gender. The university supplied Table 14 in its defense. Develop a conditional distribution by program of study to defend the university’s admission policies.
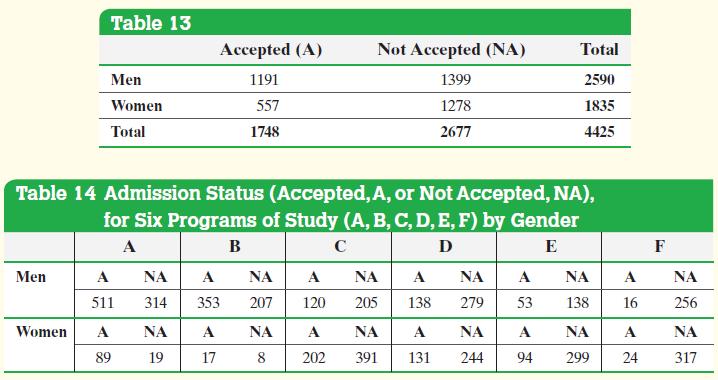
Approach Determine the proportion of accepted men for each program of study and separately determine the proportion of accepted women for each program of study.
A significant difference between the proportions of men and women accepted within each program of study may be evidence of discrimination; otherwise, the university should be exonerated.
Step by Step Answer:
The proportion of men who applied to program A and were accepted is 511511 314 0619 The proportion o...View the full answer


Statistics Informed Decisions Using Data
ISBN: 9781292157115
5th Global Edition
Authors: Michael Sullivan
