

Question: The data in Table 2 represent the results of a survey in which 200 people were asked their means of travel to work. (a) Use
The data in Table 2 represent the results of a survey in which 200 people were asked their means of travel to work.
(a) Use the survey data to build a probability model for means of travel to work.
(b) Estimate the probability that a randomly selected individual carpools to work. Interpret this result.
(c) Would it be unusual to randomly select an individual who walks to work?
Approach To build a probability model, estimate the probability of each outcome by determining its relative frequency.
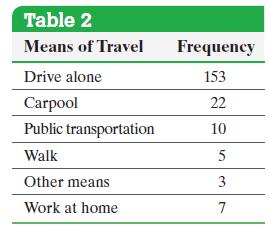
Table 2 Means of Travel Frequency Drive alone 153 Carpool 22 Public transportation 10 Walk 5 Other means 3 Work at home 7
Step by Step Solution
There are 3 Steps involved in it

Get step-by-step solutions from verified subject matter experts