

Question: The data in Table 5 represent the birth weights (in pounds) of 50 randomly sampled babies. (a) Find the mean and the median birth weight.
The data in Table 5 represent the birth weights (in pounds) of 50 randomly sampled babies.
(a) Find the mean and the median birth weight.
(b) Describe the shape of the distribution.
(c) Which measure of central tendency better describes the average birth weight?
Approach
(a) This can be done either by hand or technology. We will use a TI-84 Plus C.
(b) Draw a histogram to identify the shape of the distribution.
(c) If the data are roughly symmetric, the mean is the better measure of central tendency. If the data are skewed, the median is the better measure.
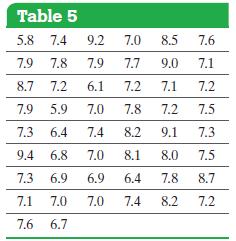
Table 5 5.8 7.4 7.4 9.2 7.0 8.5 7.6 7.9 7.8 7.9 7.7 9.0 7.1 8.7 7.2 6.1 7.2 7.1 7.2 7.9 5.9 7.0 7.8 7.2 7.5 7.3 6.4 7.4 8.2 9.1 7.3 9.4 6.8 7.0 8.1 8.0 7.5 7.3 6.9 6.9 6.4 7.8 8.7 7.1 7.0 7.0 7.4 8.2 7.2 7.6 6.7
Step by Step Solution
3.42 Rating (149 Votes )
There are 3 Steps involved in it

Get step-by-step solutions from verified subject matter experts