

Question: The data in Table 8 were collected by placing a temperature probe in a portable heater, removing the probe, and recording the temperature (in degrees
The data in Table 8 were collected by placing a temperature probe in a portable heater, removing the probe, and recording the temperature (in degrees Fahrenheit) over time (in seconds). Determine whether the relation between the temperature of the probe and time is linear.
Approach Find the least-squares regression line and determine the residuals. Plot the residuals against the explanatory variable, time. If an obvious pattern results, the linear model is not appropriate. If no pattern results, a linear model is appropriate.
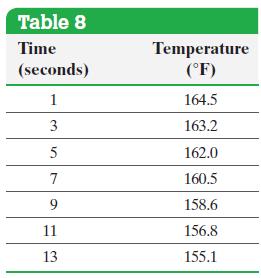
Table 8 Time (seconds) Temperature (F) 1 164.5 3 163.2 5 162.0 7 160.5 9 158.6 11 156.8 13 155.1
Step by Step Solution
3.37 Rating (153 Votes )
There are 3 Steps involved in it
Enter the data into statistical software or a graphing calculator with adv... View full answer

Get step-by-step solutions from verified subject matter experts