

Figure 23 (a) shows a scatter diagram of a set of data. The residual plot is shown
Question:
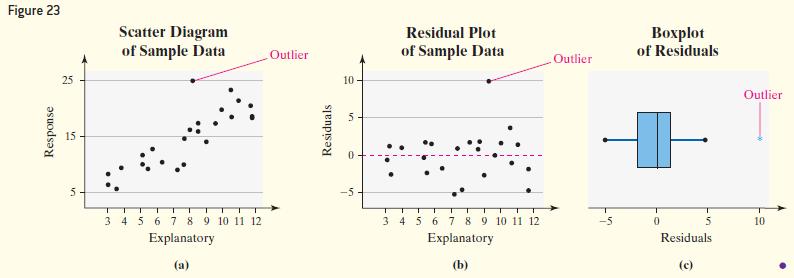
Figure 23
(a) shows a scatter diagram of a set of data. The residual plot is shown in Figure 23
(b) and the boxplot of the residuals is in Figure 23(c). Do the data have any outliers?
Approach We examine the residual plot and boxplot for outliers.
Fantastic news! We've Found the answer you've been seeking!
Step by Step Answer:
We can see that ...View the full answer

Answered By
Niala Orodi
I am a competent and an experienced writer with impeccable research and analytical skills. I am capable of producing quality content promptly. My core specialty includes health and medical sciences, but I can competently handle a vast majority of disciplines.
1+ Reviews
10+ Question Solved
Related Book For 

Statistics Informed Decisions Using Data
ISBN: 9781292157115
5th Global Edition
Authors: Michael Sullivan
Question Posted:
