

Question: The data in Table 9 represent the miles per gallon (MPG) along with potential explanatory variables weight (in thousands of pounds), number of cylinders, and
The data in Table 9 represent the miles per gallon (MPG) along with potential explanatory variables weight (in thousands of pounds), number of cylinders, and horsepower. Use a partial \(F\)-test to determine whether both cylinders and horsepower do not contribute significantly to the ability to predict miles per gallon. Use the \(\alpha=0.05\) level of significance.
Approach To perform a partial \(F\)-test, obtain the sum of squared errors from the full regression model with all three explanatory variables (weight, number of cylinders, and horsepower). Also obtain the sum of squared errors from the reduced model with only the explanatory variable weight. Then, compute the \(F\)-test statistic and compare it to the critical value to see whether the two explanatory variables, number of cylinders and horsepower, contribute significantly to explain the variability in miles per gallon.
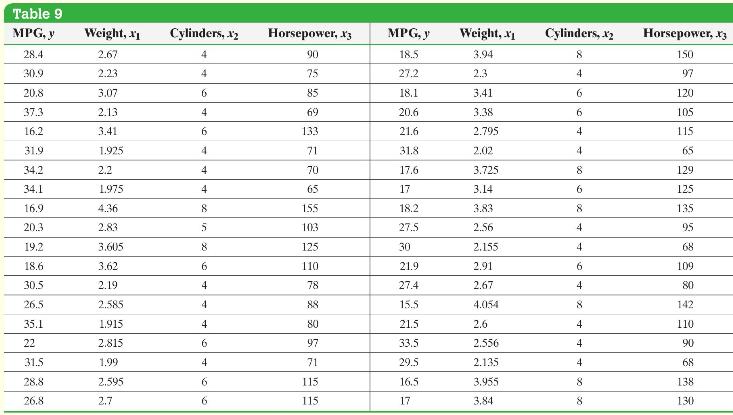
Table 9 MPG, y Weight, x1 Cylinders, x2 Horsepower, x3 MPG, y Weight, x1 Cylinders, .x2 Horsepower, .x3 28.4 2.67 4 90 18.5 3.94 8 150 30.9 2.23 4 75 27.2 2.3 4 97 20.8 3.07 6 85 18.1 3.41 6 120 37.3 2.13 4 69 20.6 3.38 6 105 16.2 3.41 6 133 21.6 2.795 4 115 31.9 1.925 4 71 31.8 2.02 4 65 34.2 2.2 4 70 17.6 3.725 8 129 34.1 1.975 4 65 17 3.14 6 125 16.9 4.36 8 1.55 18.2 3.83 8 135 20.3 2.83 5 103 27.5 2.56 4 95 19.2 3.605 8 125 30 2.155 4 68 18.6 3.62 6 110 21.9 2.91 6 109 30.5 2.19 4 78 27.4 2.67 4 80 26.5 2.585 4 88 15.5 4.054 8 142 35.1 1.915 4 80 21.5 2.6 4 110 22 2.815 6 97 33.5 2.556 4 90 31.5 1.99 4 71 29.5 2.135 4 68 28.8 2.595 6 115 16.51 3.955 8 138 26.8 2.7 6 115 17 3.84 8 130
Step by Step Solution
3.47 Rating (157 Votes )
There are 3 Steps involved in it
The hypotheses to be tested are H1 at least one of beta2 or beta3 is dif... View full answer

Get step-by-step solutions from verified subject matter experts