

Question: The following data represent the (mathrm{pH}) of rain for a random sample of 12 rain dates in a particular region. A normal probability plot suggests
The following data represent the \(\mathrm{pH}\) of rain for a random sample of 12 rain dates in a particular region. A normal probability plot suggests the data could come from a population that is normally distributed. A boxplot indicates there are no outliers. The sample standard deviation is \(s=0.330\). Construct and interpret a \(99 \%\) confidence interval for the standard deviation \(\mathrm{pH}\) of rainwater in this region.
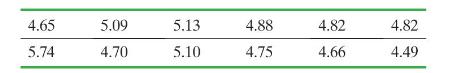
4.65 5.09 5.13 4.88 4.82 4.82 5.74 4.70 5.10 4.75 4.66 4.49
Step by Step Solution
There are 3 Steps involved in it
Lower bound 212 upper bound 0678 w... View full answer

Get step-by-step solutions from verified subject matter experts