

Question: The relative frequency distribution given in Table 1 represents the heights of a pediatricians three-year-old female patients. The raw data indicate that the mean height
The relative frequency distribution given in Table 1 represents the heights of a pediatrician’s three-year-old female patients. The raw data indicate that the mean height of the patients is μ = 38.72 inches with standard deviation σ = 3.17 inches.
(a) Draw a relative frequency histogram of the data. Comment on the shape of the distribution.
(b) Draw a normal curve with μ = 38.72 inches and σ = 3.17 inches on the relative frequency histogram. Compare the area of the rectangle for heights between 40 and 40.9 inches to the area under the normal curve for heights between 40 and 40.9 inches.
Approach
(a) Draw the relative frequency histogram. If the histogram is shaped like Figure 4, the height is approximately normal. We say “approximately normal,” rather than “normal,” because the normal curve is an idealized description of the data, and data rarely follow the curve exactly.
(b) Draw the normal curve on the histogram with the high point at m and the inflection points at μ - σ and μ + σ. Shade the rectangle corresponding to heights between 40 and 40.9 inches.
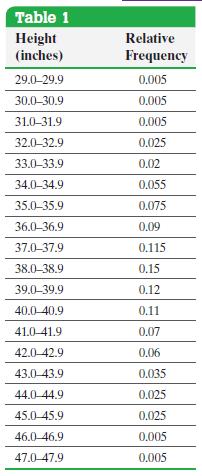
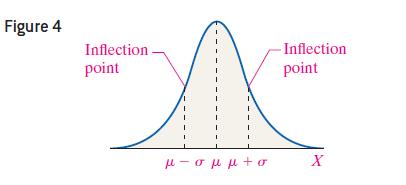
Table 1 Height (inches) Relative Frequency 29.0-29.9 0.005 30.0-30.9 0.005 31.0-31.9 0.005 32.0-32.9 0.025 33.0-33.9 0.02 34.0-34.9 0.055 35.0-35.9 0.075 36.0-36.9 0.09 37.0-37.9 0.115 38.0-38.9 0.15 39.0-39.9 0.12 40.0-40.9 0.11 41.0-41.9 0.07 42.0-42.9 0.06 43.0-43.9 0.035 44.0-44.9 0.025 45.0-45.9 0.025 46.0-46.9 0.005 47.0-47.9 0.005
Step by Step Solution
There are 3 Steps involved in it

Get step-by-step solutions from verified subject matter experts