

The website fueleconomy.gov allows drivers to report the miles per gallon of their vehicle. The data in
Question:
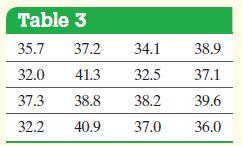
The website fueleconomy.gov allows drivers to report the miles per gallon of their vehicle. The data in Table 3 show the reported miles per gallon of 2011 Ford Focus automobiles for 16 different owners. Treat the sample as a simple random sample of all 2011 Ford Focus automobiles. Construct a 95% confidence interval for the mean miles per gallon of a 2011 Ford Focus. Interpret the interval.
Approach
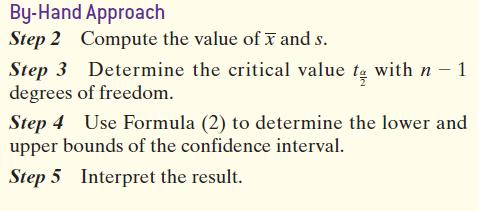
Step 1 Verify the data are obtained randomly and the sample size is small relative to the population size. Because the sample size is small, draw a normal probability plot to verify the data come from a population that is normally distributed and a boxplot to verify that there are no outliers.
Step by Step Answer:
By ...View the full answer


Statistics Informed Decisions Using Data
ISBN: 9781292157115
5th Global Edition
Authors: Michael Sullivan
