

Question: Use the data on tree diameters given in Table 1.7 to test whether the underlying distribution is normal. Estimate the mean and variance from the
Use the data on tree diameters given in Table 1.7 to test whether the underlying distribution is normal. Estimate the mean and variance from the data. Combine intervals to avoid small cell frequencies if necessary.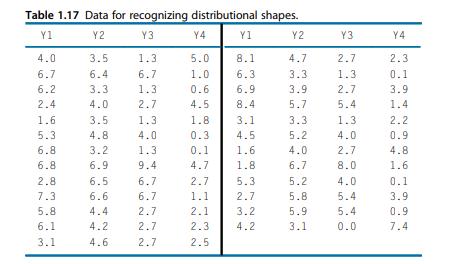
Table 1.17 Data for recognizing distributional shapes. Y1 Y2 Y3 Y4 Y1 Y2 Y3 Y4 4.0 3.5 1.3 5.0 8.1 4.7 2.7 2.3 6.7 6.4 6.7 1.0 6.3 3.3 1.3 0.1 6.2 3.3 1.3 0.6 6.9 3.9 2.7 3.9 2.4 4.0 2.7 4.5 8.4 5.7 5.4 1.4 1.6 3.5 1.3 1.8 3.1 3.3 1.3 2.2 5.3 4.8 4.0 0.3 4.5 5.2 4.0 0.9 6.8 3.2 1.31 0.1 1.6 4.0 2.7 4.8 6.8 6.9 9.4 4.7 1.8 6.7 8.0 1.6 2.8 6.5 6.7 2.7 5.3 5.2 4.0 0.1 7.3 6.6 6.7 1.1 2.7 5.8 5.4 3.9 5.8 4.4 2.7 2.1 3.2 5.9 5.4 0.9 6.1 4.2 2.7 2.3 4.2 3.1 0.0 7.4 3.1 4.6 2.7 2.5
Step by Step Solution
3.38 Rating (154 Votes )
There are 3 Steps involved in it

Get step-by-step solutions from verified subject matter experts