

Question: Use the stepwise regression procedure to find the best model to describe miles per gallon for the data in Table 10. Use a level of
Use the stepwise regression procedure to find the best model to describe miles per gallon for the data in Table 10. Use a level of significance of \(\alpha=0.15\) as the criteria for an explanatory variables to be removed from, or included in, the model.
Approach We will use the stepwise regression feature in StatCrunch. A similar feature exists in Minitab.
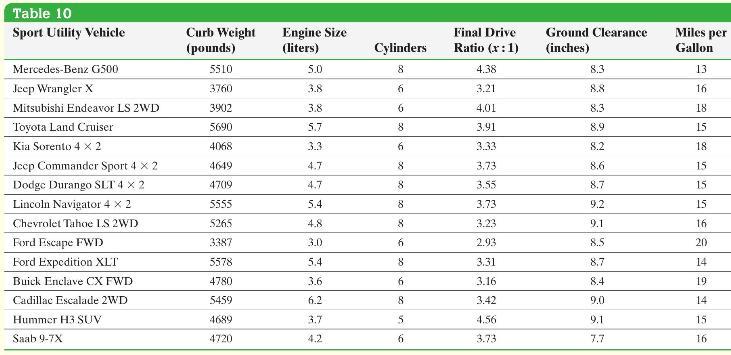
Table 10 Sport Utility Vehicle Curb Weight (pounds) Engine Size (liters) Cylinders Final Drive Ratio (:1) Ground Clearance Miles per (inches) Gallon Mercedes-Benz G500 5510 5.0 8 4.38 8.3 13 Jeep Wrangler X 3760 3.8 6 3.21 8.8 16 Mitsubishi Endeavor LS 2WD 3902 3.8 6 4.01 8.3 18 Toyota Land Cruiser 5690 5.7 8 3.91 8.9 15 Kia Sorento 4 2 4068 3.3 6 3.33 8.2 18 Jeep Commander Sport 4x2 4649 4.7 8 3.73 8.6 15 Dodge Durango SLT 4 2 4709 4.7 8 3.55 8.7 15 Lincoln Navigator 4 2 5555 5.4 8 3.73 9.2 15 Chevrolet Tahoe LS 2WD 5265 4.8 8 3.23 9.1 16 Ford Escape FWD 3387 3.0 6 2.93 8.5 20 Ford Expedition XLT 5578 5.4 8 3.31 8.7 14 Buick Enclave CX FWD 4780 3.6 6 3.16 8.4 19 Cadillac Escalade 2WD 5459 6.2 8 3.42 9.0 14 Hummer H3 SUV 4689 3.7 S 4.56 9.1 15 Saab 9-7X 4720 4.2 6 3.73 7.7 16
Step by Step Solution
3.39 Rating (158 Votes )
There are 3 Steps involved in it
Figure 37 shows the results obtained f... View full answer

Get step-by-step solutions from verified subject matter experts