

Question: Use the backward elimination procedure to find the best model to describe miles per gallon for the data in Table 10. Use a level of
Use the backward elimination procedure to find the best model to describe miles per gallon for the data in Table 10. Use a level of significance of \(\alpha=0.05\) as the criteria for an explanatory variable to be removed from the model.
Approach Again, we will use Minitab to find the least-squares regression models.
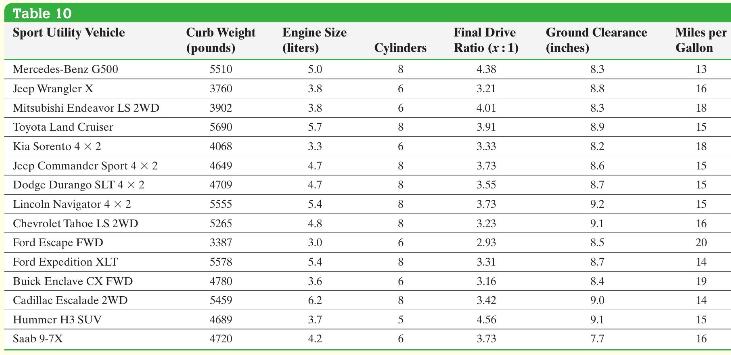
Table 10 Sport Utility Vehicle Curb Weight (pounds) Engine Size (liters) Cylinders Final Drive Ratio (:1) Ground Clearance Miles per (inches) Gallon Mercedes-Benz G500 5510 5.0 8 4.38 8.3 13 Jeep Wrangler X 3760 3.8 6 3.21 8.8 16 Mitsubishi Endeavor LS 2WD 3902 3.8 6 4.01 8.3 18 Toyota Land Cruiser 5690 5.7 8 3.911 8.9 15 Kia Sorento 4 2 4068 3.3 6 3.33 8.2 18 Jeep Commander Sport 4x2 4649 4.7 8 3.73 8.6 15 Dodge Durango SLT 4 2 4709 4.7 8 3.55 8.7 15 Lincoln Navigator 4 2 5555 5.4 8 3.73 9.2 15 Chevrolet Tahoe LS 2WD 5265 4.8 8 3.23 9.1 16 Ford Escape FWD 3387 3.0 6 2.93 8.5 20 Ford Expedition XLT 5578 5.4 8 3.31 8.7 14 Buick Enclave CX FWD 4780 3.6 6 3.16 8.4 19 Cadillac Escalade 2WD 5459 6.2 8 3.42 9.0 14 Hummer H3 SUV 4689 3.7 S 4.56 9.1 15 Saab 9-7X 4720 4.2 6 3.73 7.7 16
Step by Step Solution
3.46 Rating (156 Votes )
There are 3 Steps involved in it
First find the leastsquares regression model using all the explanatory variables See Figure 33 The Pvalue for the Ftest statistic is very low at 0009 ... View full answer

Get step-by-step solutions from verified subject matter experts