

Question: Verify the normality requirement for the data analyzed in Example 1. Approach Compute the mean value for each level of the factor and subtract the
Verify the normality requirement for the data analyzed in Example 1.
Approach Compute the mean value for each level of the factor and subtract the result from each observation to obtain the residuals. Then draw a normal probability plot of the residuals.
Data from Example 1
Prosthodontists specialize in the restoration of oral function, including the use of dental implants, veneers, dentures, and crowns. Since repairing chipped veneer is less costly and time-consuming than complete restoration, a researcher wanted to compare the shear bond strength of different repair kits for repairs of chipped porcelain veneer in fixed prosthodontics. He randomly divided 20 porcelain specimens into four treatment groups. Group 1 specimens used the Cojet system, group 2 used the Silistor system, group 3 used the Cimara system, and group 4 specimens used the Ceramic Repair system. At the conclusion of the study, shear bond strength (in megapascals, \(\mathrm{MPa}\) ) was measured according to ISO 10477. The data in Table 1 are based on the results of the study. Verify that the requirements to perform one-way ANOVA are satisfied.
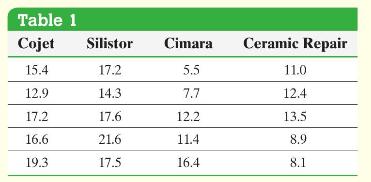
Table 1 Cojet Silistor Cimara Ceramic Repair 15.4 17.2 5.5 11.0 12.9 14.3 7.7 12.4 17.2 17.6 12.2 13.5 16.6 21.6 11.4 8.9 19.3 17.5 16.4 8.1
Step by Step Solution
3.53 Rating (160 Votes )
There are 3 Steps involved in it
The first two columns of Table 5 show the level of the factor and the value of the response vari... View full answer

Get step-by-step solutions from verified subject matter experts